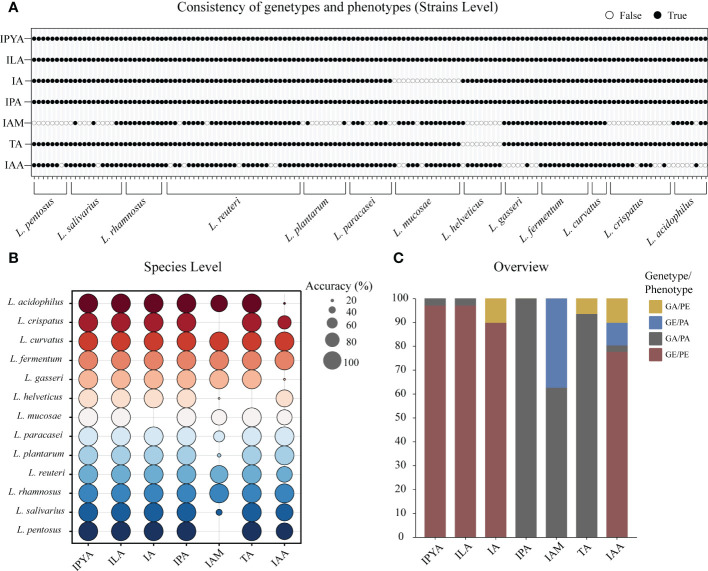
Figure 4.
The metabolites of lactic acid bacteria (LAB) predicted by homologous genes had high consistency with actual production. (A) The binary diagram illustrates whether the predicted products and metabolites of each strain are consistent. White filling denotes the opposite of the two results, black filling indicates the predicted results are consistent to the metabolic results. (B) The consistency of genotype and phenotype is reflected at the species level. The accuracy of the metabolite prediction within a species increases with the size of the prediction circle. Different colors represent different species. (C) The stacked column chart provides an overview of the consistency between the metabolomics-based actual metabolites and the genomics-based predicted metabolites in LAB. Phenotype absence (PA); Phenotype presence (PE); Gene presence (GE); Gene absence (GA).

