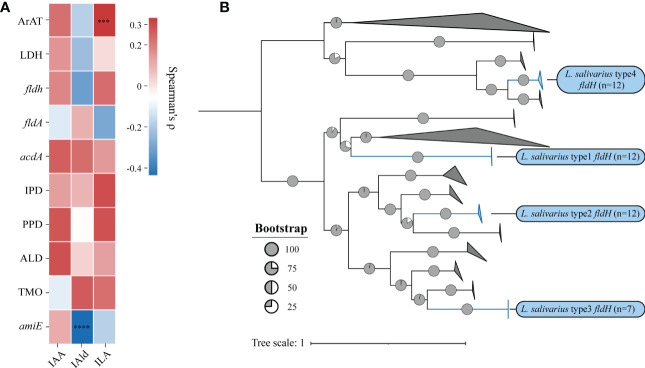
Figure 5.
(A) The heatmap represents the correlation between the number of genes and the concentration of metabolites, and the statistical significance will be marked only when Spearman’s ρ (Benjamin Hochberg false discovery rate [FDR]) is greater than 0.3.***p = 0.0003, ****p < 0.0001. (B) Phylogenetic trees were built using the indolelactate dehydrogenase (fldH) homologous sequences of all lactic acid bacteria. Without modifying the topological structure of phylogenetic trees, the folded branches were used to facilitate the display of two different types of fldH sequences of L. salivarius. The folded cluster of fldH from L. salivarius was marked blue.

