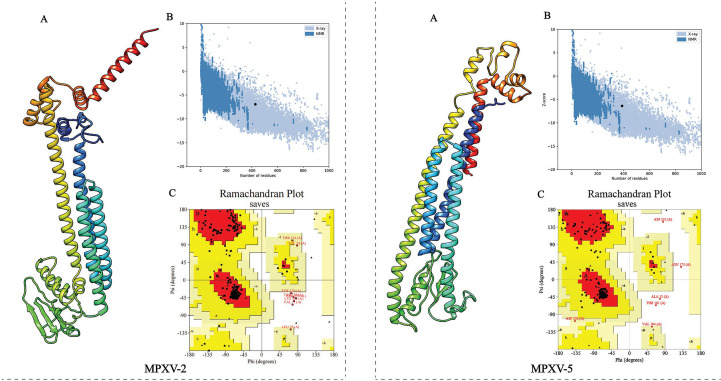
Figure 4.
Refinement and quality validation of the three dimensional (3D) structure. (A) The refined 3D structure. (C) Ramachandran plots of the refined 3D structure generated by PROCHECK server; Red regions represent the most favored regions, dark yellow regions represent the additional allowed region, light yellow regions represent the generally allowed regions, and white regions denote the disallowed regions. (B) Z-Score plot of the refined 3D structure predicted by ProSA-Web server.

