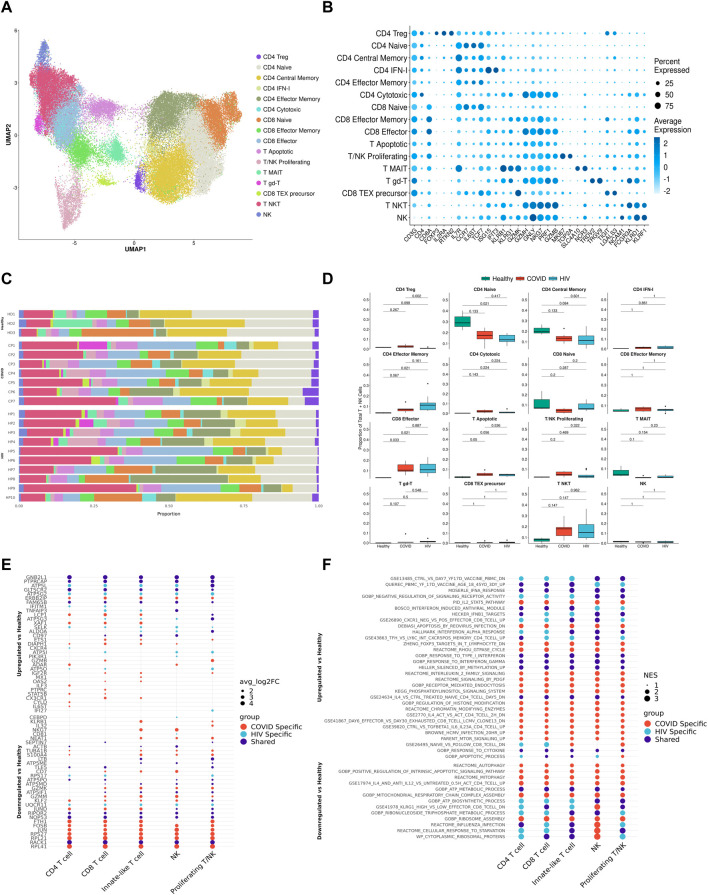
FIGURE 5.
T cells in COVID-19 and HIV-1 show varied IFN-I and activation signatures. (A) UMAP embeddings of T cells colored by subtype. (B) Dot plot of canonical T cell marker expression across subtypes. (C) Stacked bar plots of the relative frequency of subtypes present in each patient. (D) Figure 5D: Box plots of the proportions of each T/NK cell subset across each disease condition. Proportions are computed for each patient by dividing their number of cells in each T/NK subset by their total number of T + NK cells. p-values are computed with Wilcoxon signed-rank test with Holm-Bonferroni adjustment. (E) Dot plots of the key genes differentially upregulated (top) or downregulated (bottom) compared to healthy controls. (F) Dot plot of enriched biological pathways from differentially expressed genes that were found to be upregulated (top) or downregulated (bottom) compared to healthy controls.

