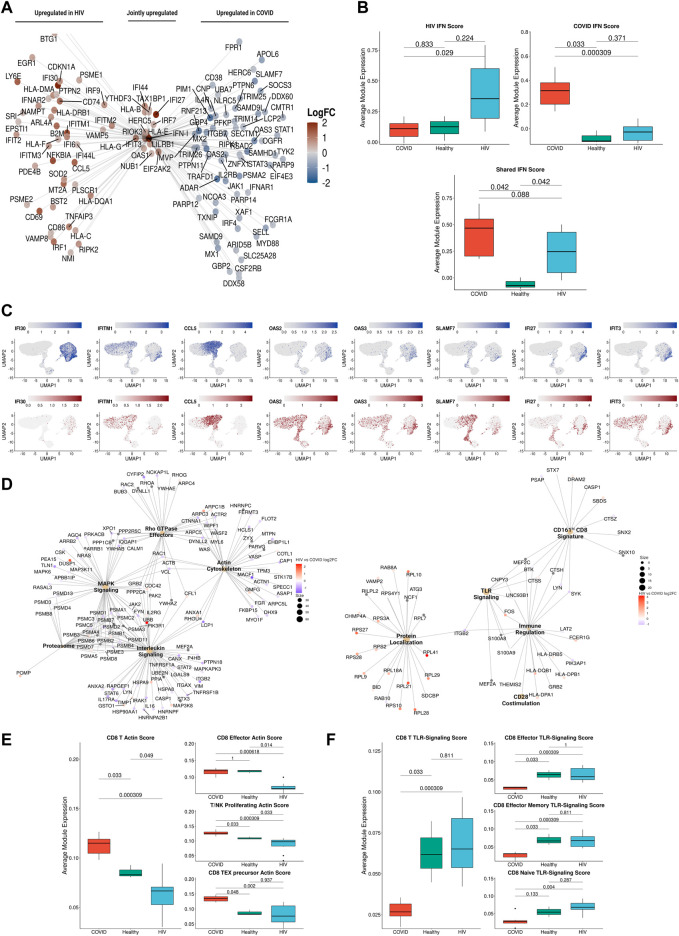
FIGURE 6.
IFN-I signaling is correlated with divergent biological functions in COVID-19 versus HIV-1. (A) Network plot of genes related to IFN-I signaling that are differentially upregulated in COVID-19 (Right), HIV-1 (Left), or jointly upregulated compared to healthy controls. Genes are colored based on Log-2-fold change in expression in HIV-1+ versus COVID-19 patients. (B) Box plots of the average expression of HIV-1, COVID, and shared IFN-I module scores for each condition. p-values are computed with Wilcoxon signed-rank test with Holm-Bonferroni adjustment. (C) Normalized gene expression plots of IFN-I genes in COVID-19 (top) and HIV-1 (bottom). (D) Network plot of key pathways correlated with IFN-I signaling in COVID-19 (left) and HIV-1+ patients (right). Size of each center corresponds to the number of genes present in the pathway. Genes are colored based on Log-2-fold change in expression in HIV-1+ versus COVID-19 patients. (E) Box plots of the average expression of CD8+ T cell actin polymerization module scores for each disease condition (left). Box plots of the average expression of CD8+ effector, T/NK proliferating, and CD8+ Tex precursor scores for each disease condition (right). p-values are computed with Wilcoxon signed-rank test with Holm-Bonferroni adjustment. (F) Box plots of the average expression of CD8+ T cell TLR-signaling module scores for each disease condition (left). Box plots of the average expression of CD8+ effector, CD8+ effector memory and CD8+ naive TLR-signaling scores for each disease condition (right). p-values are computed with Wilcoxon signed-rank test with Holm-Bonferroni adjustment.

