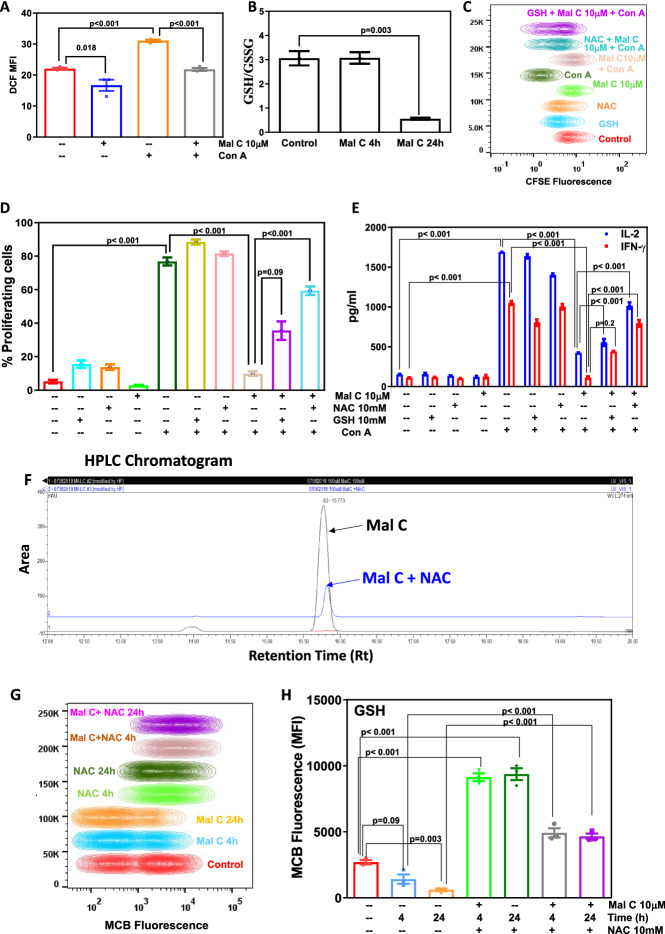
Figure 3.
Mal C modulated cellular redox, and thiol antioxidants abrogated its anti-inflammatory effects: Cells were treated with vehicle or Mal C (2 h) followed by stimulation with Con A (30 min). Unstimulated or stimulated cells were stained with H2DCFDA, and subsequently change in fluorescence was monitored using a flow cytometer. The bar graph shows mean fluorescence intensity (MFI) (A). Lymphocytes incubated with Mal C (10 μM) for the indicated time points were processed for estimation of cellular GSH. The GSH/GSSG ratio is graphed in (B). Lymphocytes stained with CFSE were incubated with thiol antioxidants NAC (10 mM) or GSH (10 mM) for 2 h prior to incubation with Mal C. Following mitogenic stimulation by Con A for 72 h, cells were acquired using a flow cytometer, and the concatenated flow cytometric histogram is shown in (C). The percentage of proliferating cells is graphed in (D). Culture supernatants harvested at 24 h were subjected to estimation of cytokines using ELISA. The cytokine concentration (pg/mL) is graphed in (E). Three independent experiments were performed with data points representing mean±SEM from three replicates from one such experiment. Mal C interacted with N-acetyl cysteine (NAC): Mal C (10 μM) was incubated with NAC (100 μM) at 37°C for 1 h in 1X PBS and run on HPLC. The HPLC chromatogram is shown in (F). NAC reversed Mal C-induced depletion of cellular thiols: Cells incubated with Mal C or NAC or both for indicated time points were stained with monochlorobimane (MCB) and subsequently acquired using a flow cytometer for monitoring change in fluorescence, and the concatenated flow cytometric histograms are shown in (G). MCB mean fluorescence intensity is graphed in (H). Three independent experiments were performed with data points representing means±SEM from three replicates in each experiment.

