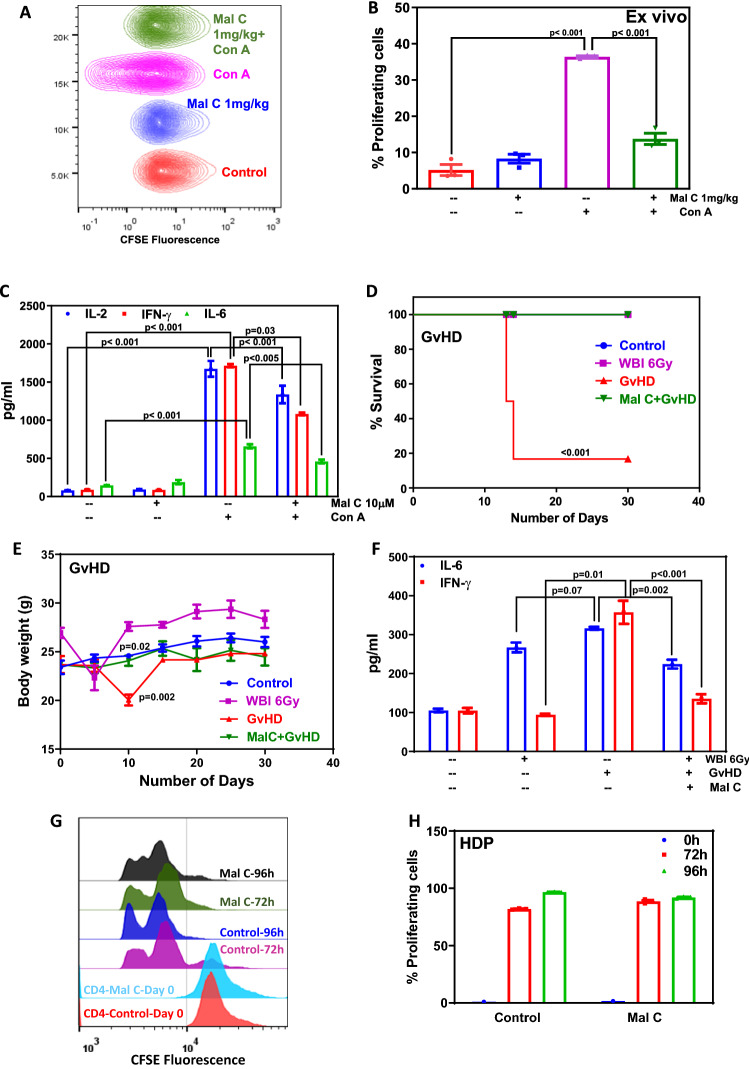
Figure 4.
Mal C treatment suppressed T-cell proliferation and cytokine secretion ex vivo: Mice administered with Mal C (10 mg/kg body weight intraperitoneally) were sacrificed, and the lymphocytes were stained with CFSE followed by stimulation with Con A and cultured for 24 h or 72 h. CFSE fluorescence was monitored by acquiring cells on a flow cytometer. Concatenated flow cytometric histograms are shown (A). The percentage of proliferating cells was calculated based on CFSE dye dilution, and is shown in a bar graph (B). Culture supernatants were harvested from lymphocytes following stimulation with Con A (2.5 µg/mL) after culturing for 24 h and subsequently subjected to cytokine (IL-2, IL-6, and IFN-γ) analysis. The bar graph represents cytokine concentration (pg/mL) (C). Three independent experiments were performed with data points representing means±S.E.M from three replicates from one such experiment (n=3 mice per group). Mal C inhibited GvHD but did not inhibit homeostatic proliferation: Transplantation of allogeneic lymphocytes (10×106 from C57BL/6 mice) into lymphopenic recipients (WBI (6 Gy) BALB/c mice) induced GvHD. The symptoms of GvHD induction such as loss of weight, level of pro-inflammatory cytokines, and survival were monitored. Allogeneic lymphocytes were treated with vehicle or Mal C before transplantation for 4 h, and subsequently, the mice were monitored for 30 days survival and body weight changes. The percentage of survival of mice is represented by a line graph shown in (D), whereas changes in body weight of mice are shown in a line graph in (E). Three independent experiments were performed with 6 mice (n=6) in each group. Data points represent means±SEM from six replicates from 6 mice from one such experiment. To assess the GvHD, mice were sacrificed on day 5 post allogeneic cell transplantation and the levels of serum cytokines were estimated. The concentration of cytokines present in the serum expressed as pg/mL is graphed in (F). Three independent experiments were performed with 3 mice (n=3) in each group. Data points represent mean±SEM from three replicates from one such experiment. For homeostasis-driven proliferation, CD4+ T-cells were isolated from donor BALB/c mice and subsequently stained with CFSE followed by incubation with vehicle or Mal C (10 μM, 4 h). At the end of incubation, 1 million cells were transplanted into syngeneic lymphopenic recipient mice through the tail vein. After 72 h and 96 h, post transplantation, lymphocytes were isolated and subjected to flow cytometric acquiring followed by analysis. Overlaid flow cytometric histograms are shown in (G). The bar graphs show the percentage of proliferating cells in control and Mal C-treated groups at 0, 72, and 96 h, respectively, (H). Three independent experiments were performed with 3 mice (n=3) in each group. Data points represent means±SEM from three replicates from one such experiment.

