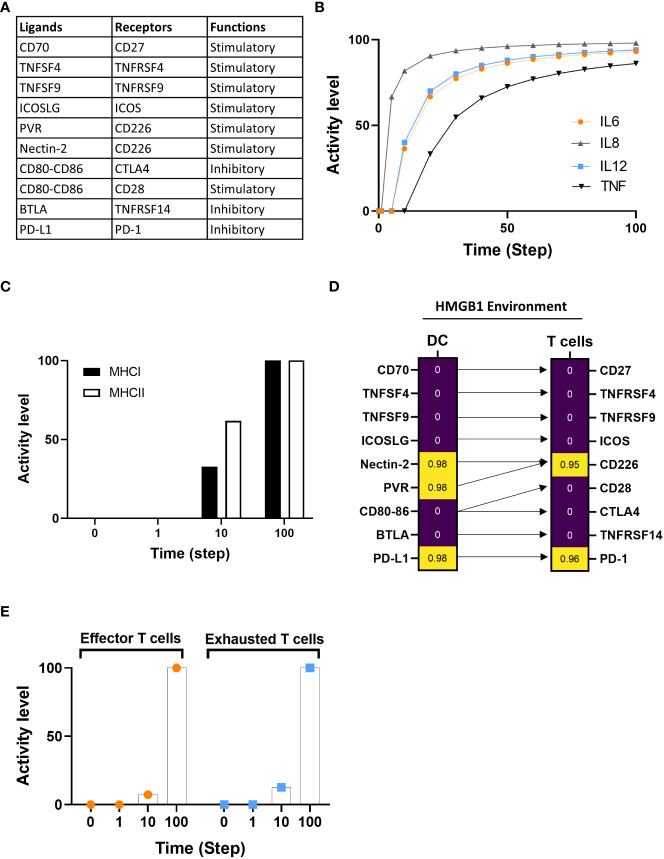
Figure 5.
Investigation of DCs-T cells crosstalk under an HMGB1 tumor environment. (A) The table indicates the immune checkpoint pairing between ligands and associated receptors along with the type of functions (stimulatory or inhibitory). (B) Assessment of IL6, IL8, IL12, and TNF cytokine expression under HMGB1 environment. (C) The activity level of MHC classes I and II are between 0 and 10, with the time 100 added at the final expression of both classes. (D) Standardized regression coefficient (SRC) between ligands and associated receptors on DC and T cells with HMGB1 environment. High and low SRC presented with yellow and purple, respectively. Arrows link the ligands to their respective receptors. (E) Time course of effector T and exhausted T cells activity level expression at a probability of activation at time steps 0, 1, 10, and 100 in HMGB1 simulation.

