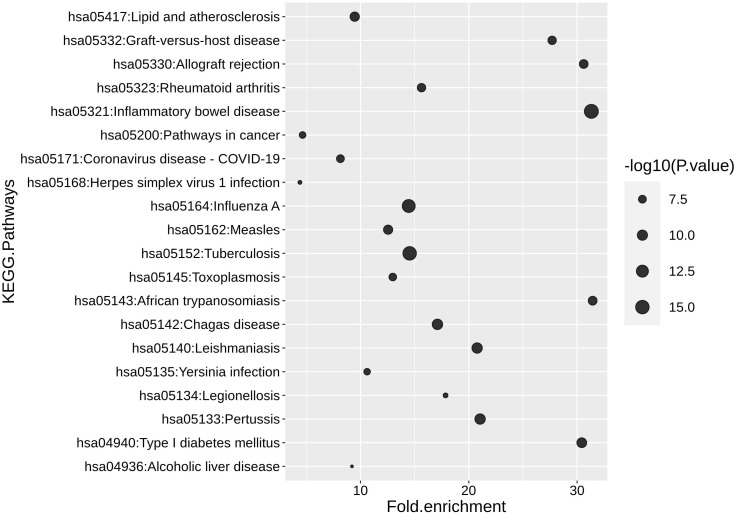
Figure 6.
The top 20 human diseases and signaling pathways associated with the DC model. P-values and fold enrichment of KEGG pathways in DC. -log 10 of P-values was used for visualization. Thus, larger dot sizes correspond to lower P-values. The cutoffs P-value < 0.05 and a false discovery rate (FDR) < 5% were set for significant enrichment.

