Figure 1.

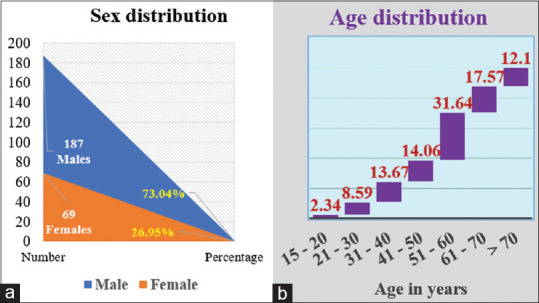
Figures depicting the gender distribution and the highest age group involved. (a) A graph illustrating the distribution of sex. (b) A graph representing the distribution of age

Figures depicting the gender distribution and the highest age group involved. (a) A graph illustrating the distribution of sex. (b) A graph representing the distribution of age