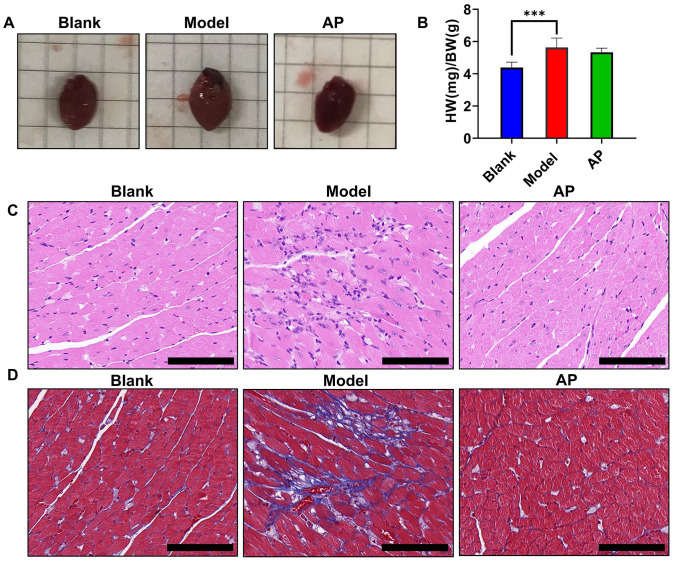
Figure 4.
Morphologic and histopathologic alterations of hearts. (A) Representative image of the hearts; (B) the ratio of heart weight to body weight among the groups; (C) hematoxylin–eosin staining of left ventricular tissue under light microscopy; (D) Masson’s staining of left ventricular tissue under light microscopy. Values are expressed as the mean value ± SD of determinations (blank n = 11, model n = 9, AP n = 12). Scale bar is 100 μM. (A color version of this figure is available in the online journal.)
***P < 0.01.

