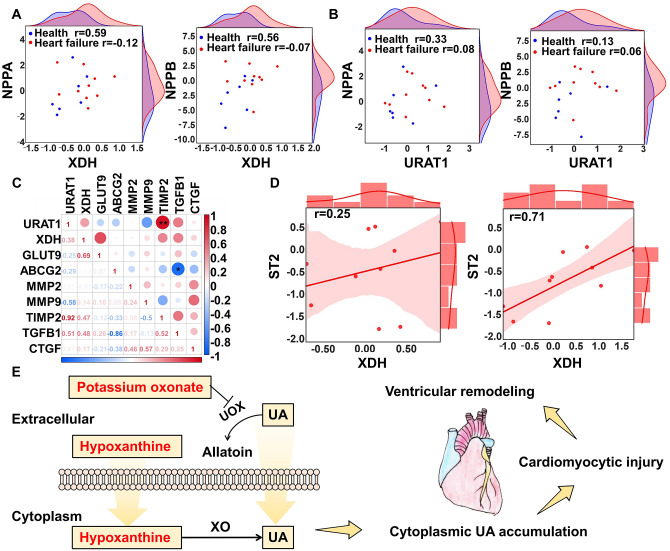
Figure 5.
Visualized demonstration of the inducers. (A) Scatter points indicated relationship between XDH and NPPA and NPPB; (B) scatter points indicated relationship between URAT1 and NPPA and NPPB; (C) multiple correlation analysis between URAT1, XDH, and fibrosis markers; (D) regression curve between XDH, URAT1, and ST1 in end-heart failure patients; (E) description of the modeling rationale. (A color version of this figure is available in the online journal.)

