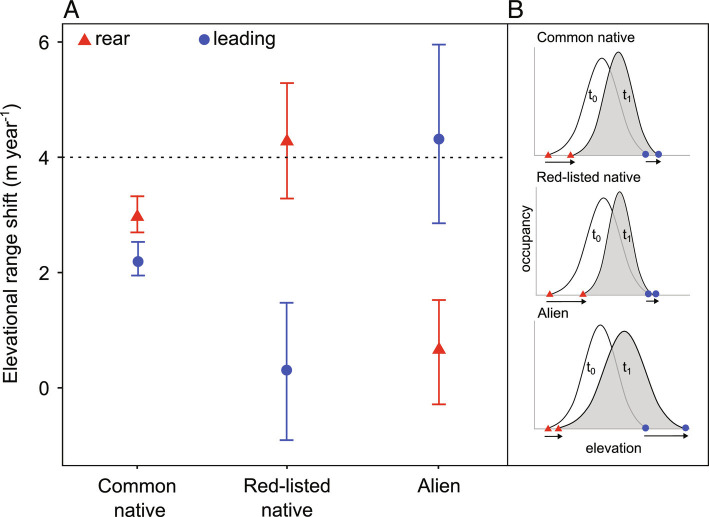
Fig. 1.
Range shifts of common native, red-listed native and alien plant species. (A) Mean shift rate and CIs (95%) at the rear (red) and leading (blue) edge over the last 30 y (1990 to 2019). The mean and 95% CIs around the mean were computed using 1,000 permutations in the EzPlot() function in R. The horizontal dashed line shows the expected shift to track climate change based on the current rate of warming in the study area (c. 4 m y−1). (B) Graphical schematic representation of the historical (t0) and current (t1) density distributions for common native, red-listed native and alien species. The average range change percentage was −0.44, −5.69, and +12.02% for common natives, red-listed natives and aliens, respectively. N = 1,318 native common species, N = 108 native red-listed species, and N = 53 alien species, for which at least 30 records in the historical (1990 to 2004) and 30 records in the current period (2005 to 2019) were available.

