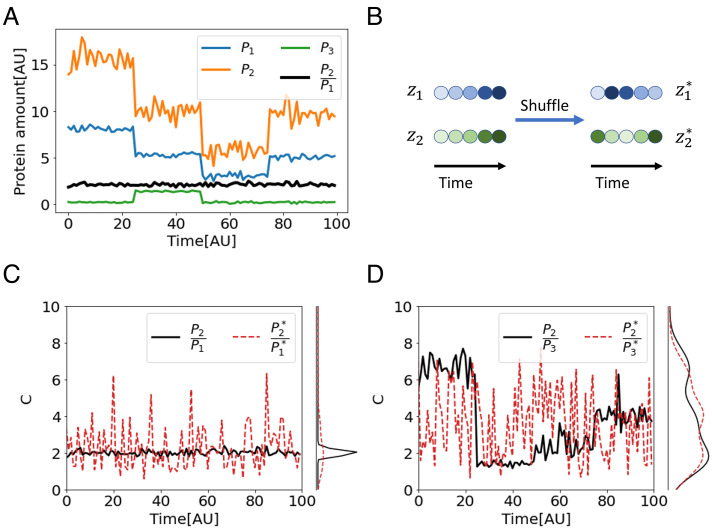
Fig. 1.
Coefficient of Regulation (CR) as a measure of combination invariance. (A) A synthetic example of ratio control in a biological system. The amounts of three proteins, P1, P2, and P3, fluctuate over time and are modulated by discontinuous perturbations (t = 25, 50, 75). In the face of these perturbations, the ratio is held around a setpoint cset = 2 with small fluctuations (noise with SD 0.15). (B) To calculate CR, temporal correlations between the measurements are destroyed by shuffling the time points of each measurement independently. (C) While the distribution of in real data is narrow (black), the distribution of the ratio between shuffled measurements is much wider (red dashed), resulting in a small CR. (D) Since there is no correlation between P2 and P3, the distributions of their ratio in real and in shuffled data are of the same width, and CR = 1.

