Fig. 5.
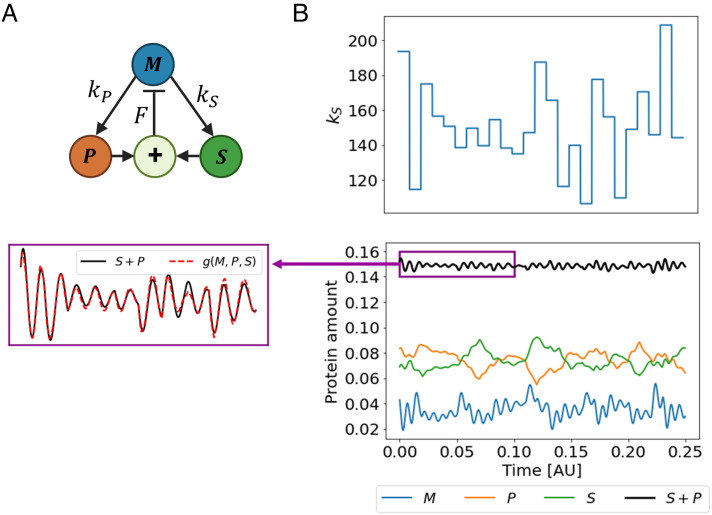
IRAS captures the control objective in a kinetic model. (A) An illustration of the closed loop system. Protein M induces the production of both S and P and receives a negative feedback of their sum. (B) Top: perturbations cause step-like variation in kS over time. The duration of each step is 0.01 which is much longer than the timescale of the feedback loop (F = 2, 000). This enables the controller to track the changes in S + P. Each step was sampled from a normal distribution with a mean 150 and a SD 30. The rest of the parameters were sampled similarly: γP, γS = 70 ± 15, γM = 80 ± 15, kP = 150 ± 30. Bottom Right: The trajectories of the three proteins and the combination S + P over time. The Bottom Left: a zoom-in of the combination P + S (black) within the purple box in the Right panel along with the output of the algorithm (dashed red).

