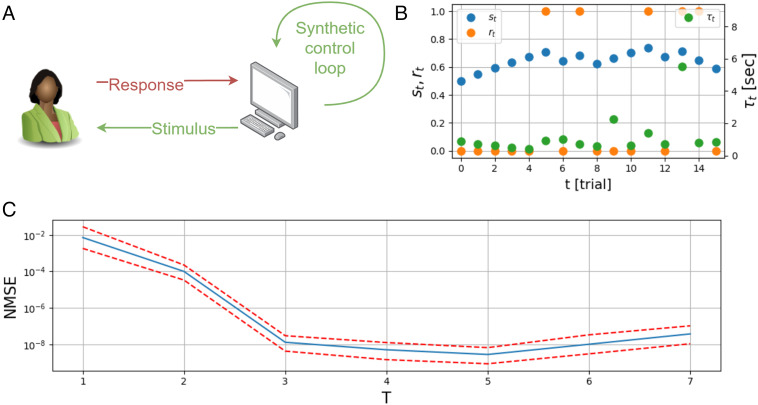
Fig. 6.
Relational dynamics in perception (A) Trial-trial variability in human sensory detection is tested. A synthetic feedback controller sets the stimulus, which is the contrast of a foreground raster displayed on the screen. Then, the user responds positively when detecting the raster or negatively when not. (B) Raw data from psychophysics experiment. A portion of the measured time-series zt = [st rt τt] in a human sensory detection experiment. The stimulus st (blue dots) is a time-series of image-contrast values, the responses rt (orange dots) are a Boolean time-series of detection, and τt (green dots) is the reaction time from stimulus to response. (C) Normalized mean-square-errors of stimulus estimation values as defined in Eq. 16. Stimulus estimation is obtained from the analytical expression of the feedback loop detected. The estimation errors decrease monotonously up to T = 5 implying an effective timescale of 5 trials. Dashed red lines are the MSE of errors higher and lower than the MSE which lies on the blue line.

