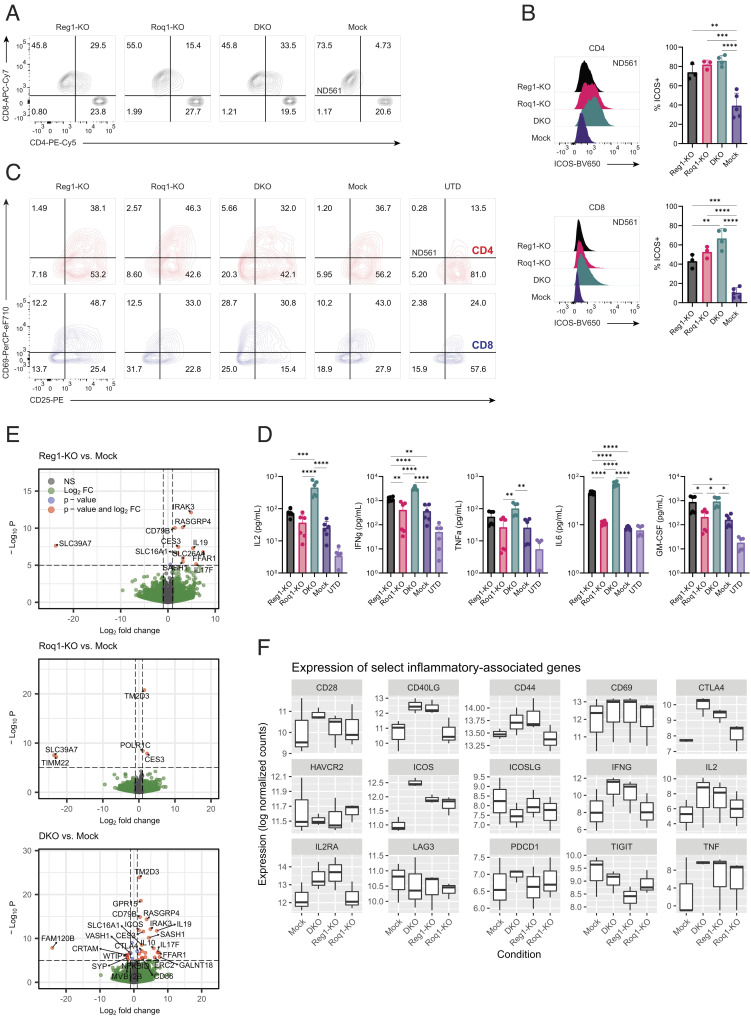
Fig. 1.
Regnase-1 and Roquin-1 double knockout alters the activation profile of resting engineered T cells. (A) Healthy human donor T cells were subject to CAR-T cell expansion and cryopreserved. Thawed CAR-T cells were rested overnight in media supplemented with cytokines before flow cytometry analysis of CD4 and CD8. Knockout of Regnase-1 and/or Roquin-1 increased expression of CD4, an activation marker, on CD8 T cells. Plots shown are representative of three independent donors. (B) Expression of ICOS, a costimulatory receptor, from CAR-T cells rested overnight with cytokines. Left flow plots shown are representative of three independent donors. Right graphs show percentage of ICOS+ T cells summarized among at least three independent donors. Top and Bottom figures refer to CD4 and CD8 T cells, respectively. Error bars represent SD. One-way ANOVA was used for analysis followed by Tukey’s multiple comparisons test. (C) Expression of activation markers CD25 and CD69 on CD4 (red) or CD8 (blue) CAR-T cells and UTD controls after coculture with mesothelin-negative K562 cells overnight. Plots shown are representative of two independent experiments from two independent donors each performed in triplicate. (D) Secretion of Th1 and inflammatory cytokines (IL2, IFNg, TNFa, IL6, and GM-CSF) measured via Luminex assay. CAR-T cells and untransduced (UTD) T cell controls were cocultured with mesothelin-negative K562 cells overnight, and supernatants were collected for analysis. Data shown are pooled from two independent experiments from two independent donors each performed in triplicate. Error bars represent SD. One-way ANOVA was used for analysis followed by Tukey’s multiple comparisons test. (E) Volcano plots showing differentially expressed genes between Regnase-1, Roquin-1, and double knockout versus mock engineered T cells (pooled n = 2 CAR-T and n = 1 TCR-T for total n = 3 independent donors) after thaw and overnight rest with cytokines. Genes that are statistically significant (adjusted P ≤ 0.005) and have a Log2FC ≥ 1 are shown in red. Statistical significance was calculated using the Wald test with Benjamini–Hochberg multiple testing correction. (F) Expression levels of various inflammatory genes, including Th1 cytokines (IL2, IFNg, TNFa), activation markers (CD25, CD69, CD40LG, PD1, LAG3), and costimulatory receptors (CD28, ICOS). Values shown are log normalized transcript counts of bulk RNA sequencing data from three independent donors (n = 2 CAR-T and n = 1 TCR-T). Box plots show medians, interquartile ranges, minimum, and maximum values. Not shown = not significant, *P ≤ 0.05; **P ≤ 0.01; ***P ≤ 0.001; ****P ≤ 0.0001.

