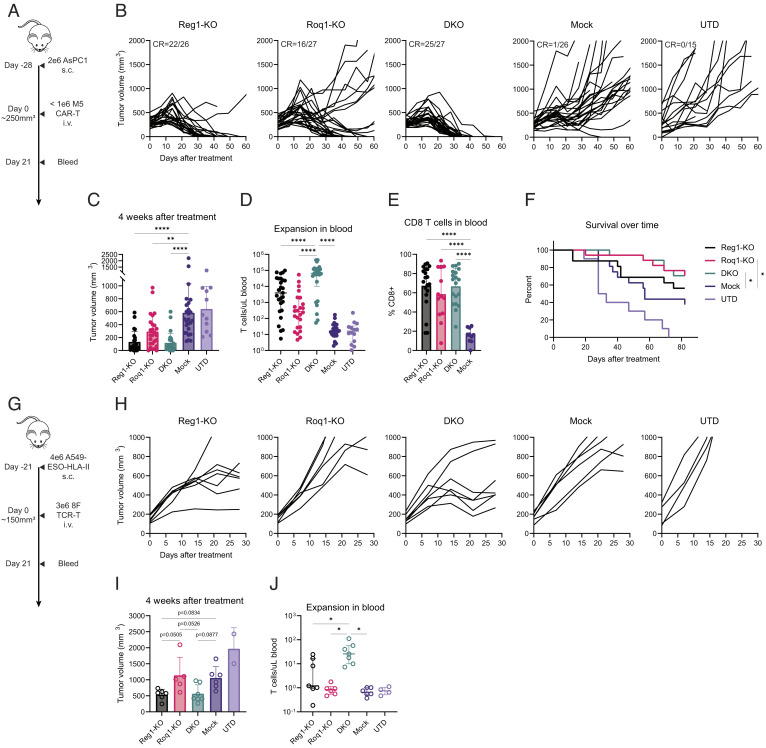
Fig. 2.
Regnase-1 and Roquin-1 double knockout increases antitumor function of engineered T cells. (A) Schematic of in vivo mouse experiments to evaluate antitumor efficacy of knockout CAR-T cells. A total of 2 × 10⁶ AsPC1 cells were injected subcutaneously on the right flank of NSG mice (n ≥ 15 mice/group across three experiments with two donors). Tumors were grown until sizes reached ~250 mm3 before treatment with a submillion (0.5 × 10⁶ or 0.75 × 10⁶) dose of mesoCAR+ cells. Mice were monitored, weighed, and measured with calipers once a week, bled after 3 wk, and sacrificed once tumors reached >2 cm in any dimension. Power analysis was not used to determine the sizes of treatment groups. (B–E) Antitumor function of Regnase-1 and/or Roquin-1 knockout CAR-T cells compared to mock CAR-T cells with UTD controls. Data shown are pooled from three independent experiments with two independent donors (one donor at 0.5 × 10⁶ mesoCAR+ dose and one donor at both 0.5 × 10⁶ and 0.75 × 10⁶ mesoCAR+ doses). (B) Tumor growth over time following treatment with CAR-T cells or UTD control. (C) Tumor sizes 4 wk after treatment with CAR-T cells or UTD control. Error bars represent SD. (D) Expansion of T cells in peripheral blood 21 d after treatment. Horizontal bars represent median with interquartile ranges. (E) CD8 percentage of T cells in peripheral blood 21 d after treatment. Error bars represent SD. For (C–E), one-way ANOVA was used for statistical analysis followed by Tukey’s multiple comparisons test. (F) Kaplan–Meier curve demonstrating that Regnase-1 and/or Roquin-1 knockout CAR-T cells enhance survival compared to mock. Data shown are pooled from two independent experiments with two independent donors at a 0.5 × 10⁶ mesoCAR+ dose (n = 16 Reg1-KO; n = 17 Roq1-KO; n = 17 DKO; n = 16 Mock; n = 10 UTD). Log-rank test was used for statistical analysis. (G) Schematic of in vivo mouse experiments to evaluate antitumor efficacy of knockout TCR-T cells. 4 × 10⁶ A549-ESO-HLA-II cells were injected subcutaneously on the right flank of NSG mice. Tumors were grown until sizes reached ~150 mm3 before treatment with 3 × 10⁶ NYESO TCR+ cells (n ≥ 4 mice/group across two experiments with two donors). Mice were monitored, weighed, and measured with calipers once a week, bled after 3 wk, and sacrificed once tumors reached >2 cm in any dimension. Power analysis was not used to determine the sizes of treatment groups. (H–J) Antitumor function of Regnase-1 and/or Roquin-1 knockout TCR-T cells compared with mock TCR-T cells with UTD controls. Data shown are pooled from two independent experiments with two independent donors. (H) Tumor growth over time following treatment with TCR-T cells or UTD control. (I) Tumor sizes 4 wk after treatment. Error bars represent SD. (J) Expansion of T cells in peripheral blood 21 d after treatment. Horizontal bars represent median with interquartile ranges. For (H) to (I), one-way ANOVA was used for statistical analysis followed by Tukey’s multiple comparisons test. Not shown = not significant, *P ≤ 0.05; **P ≤ 0.01; ***P ≤ 0.001; ****P ≤ 0.0001.

