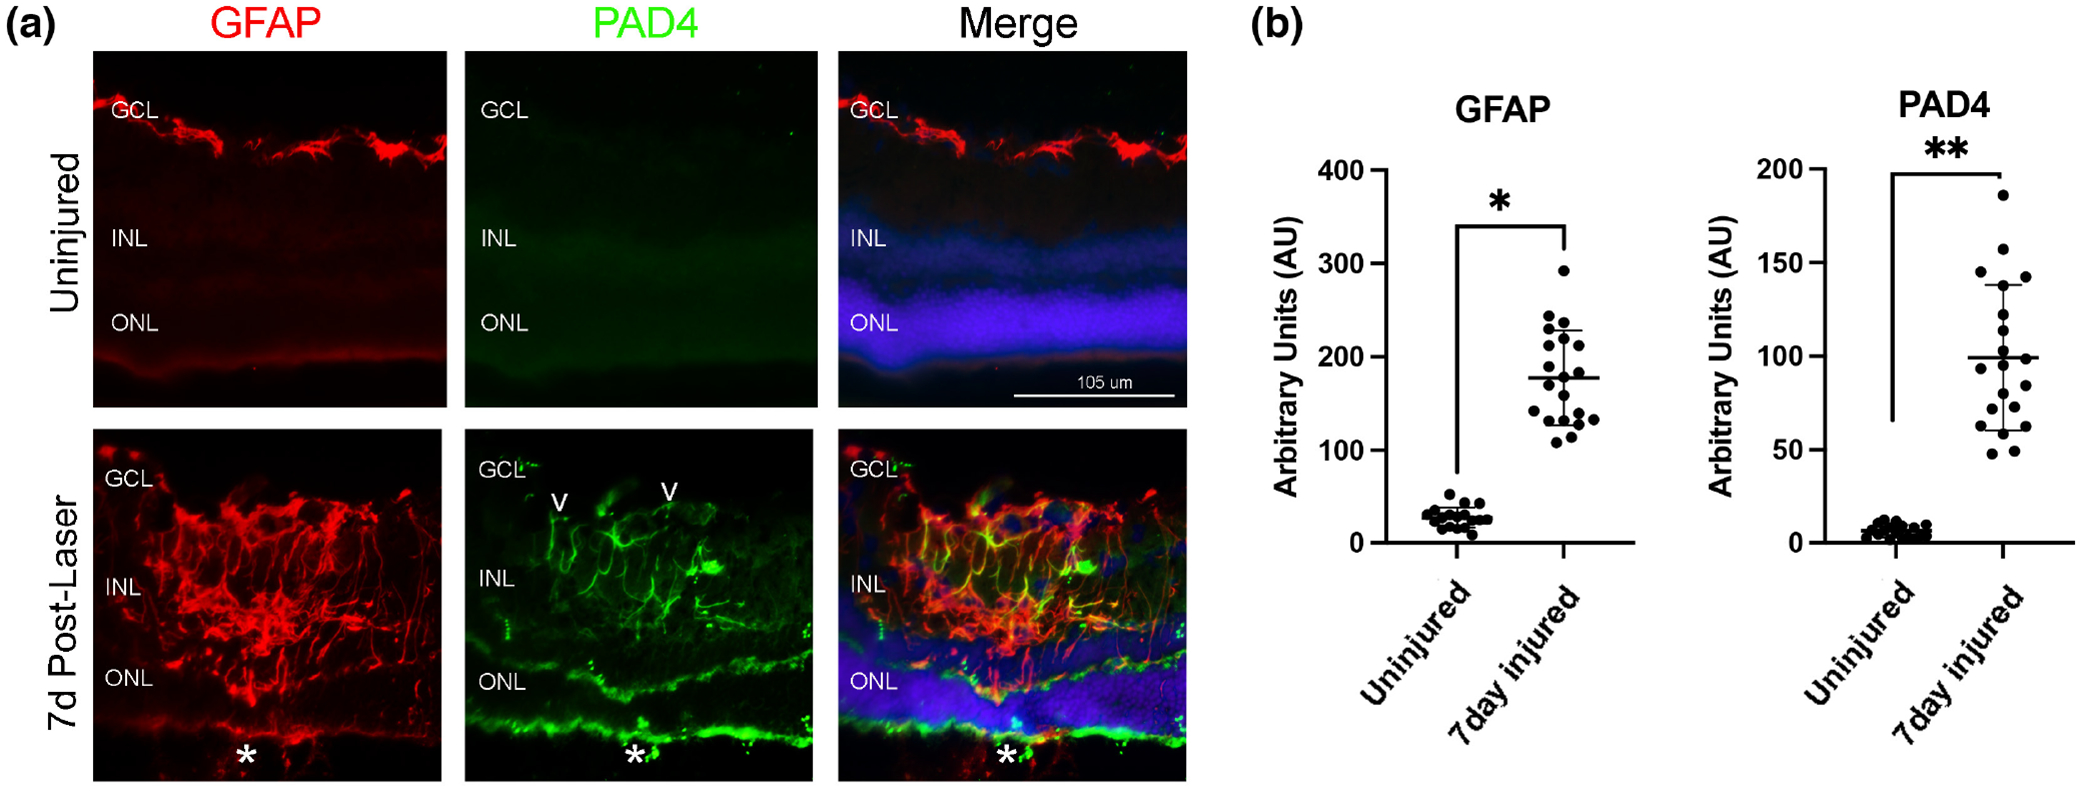
FIGURE 2.

PAD4 is upregulated and localized with GFAP in the injured mouse retina. (a) Representative epifluorescent images of control uninjured and 7-day post-injury retinal samples stained for GFAP (red), PAD4 (green). Nuclei were visualized with DAPI (blue). PAD4 staining was observed colocalized with GFAP filaments originating from the endfeet (white empty arrowheads) and extending to the inner retina of injured tissues. Merge is an overlay of all staining. All images were taken at 20× magnification. GCL, ganglion cell layer; INL, inner nuclear layer; ONL, outer nuclear layer. The asterisks (a) denote the site of the laser lesion. (b) Quantification of GFAP and PAD4 staining was done using ImageJ software and data analyzed using graph PAD Prism software. The Mann–Whitney two-tailed nonparametric test was used for statistical analysis. Median GFAP abundance of uninjured and 7-day injured samples was 26.68 and 174.0, respectively; the two groups differed significantly (U = 0, n1 = 18, n2 = 20, *p < .0001). Median PAD4 abundance of uninjured and 7-day injured samples was 6.15 and 94.40, respectively; the two groups differed significantly (U = 0, n1 = 18, n2 = 20, **p < .0001). N = 6 mice/group, average of three sections per mouse. Data are presented as mean ± SD, p < .05 is considered significant. Scale bar = 105 μm.
