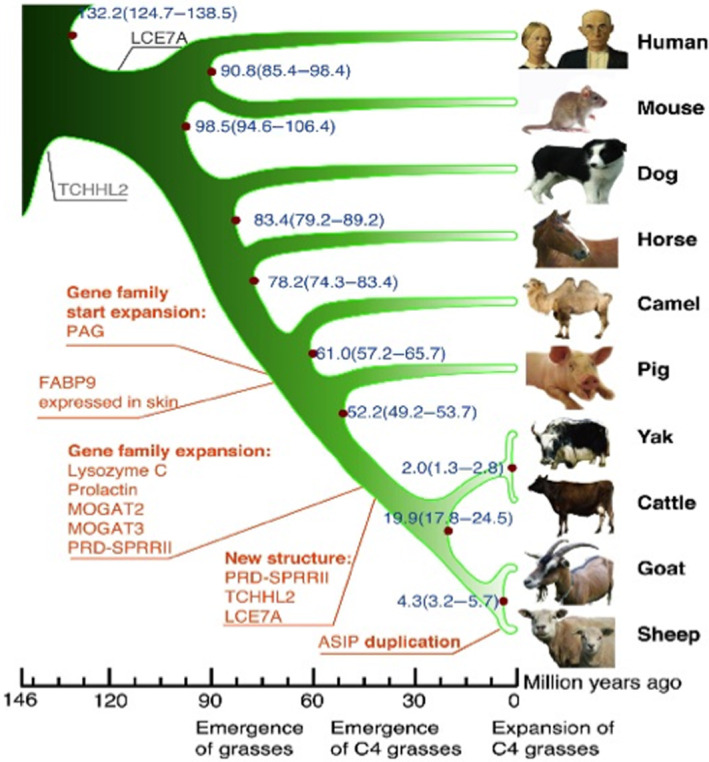
FIGURE 1.

Phylogenetic tree of sheep and related animals. generated using single‐copy orthologous genes. Origins (black) and amplificationgenes (red). Scale is in millions of years ago (Mya). Blue numbers on the nodes are calculated divergence times from present (Mya) and its confidence interval. Figure reproduced from 93 under Open Access
