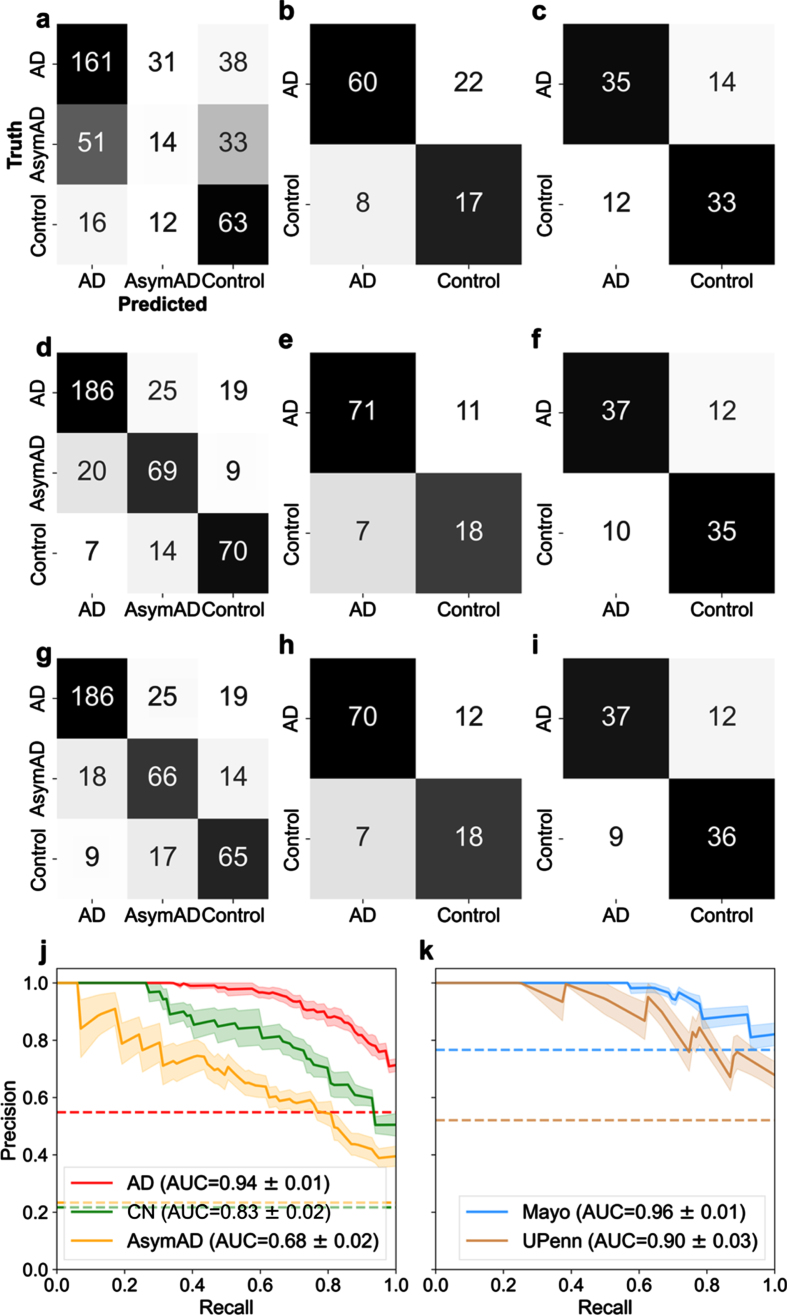
Fig. 2.
Examination of classification performance for Alzheimer’s disease (AD), asymptomatic Alzheimer’s Disease (AsymAD), and control using n = 29 best predictive proteins in a one-versus-rest classification setting. Confusion matrices (a-i) illustrate numeric classification results, whereas precision-recall curves (j-k.) denote the area under the curve (AUC) with standard error (± σ) to quantify overall classification performance. a-c) Confusion matrices illustrating classification results when using APP alone to classify patient diagnostic class in the (a) LFQ, (b) Mayo, and (c) UPenn datasets. d-f) Confusion matrices illustrating classification results with all 29 “best” or most predictive proteins. g-i) Confusion matrices illustrating results when APP was excluded and the remaining 28 predictive proteins were used for classification of patient diagnosis. APP is widely considered pivotal to the AD etiology. However, these results illustrate APP is not overtly biasing diagnostic classification ability. j) Precision-recall curve for the 3 classes (Control, AsymAD, AD) in the LFQ dataset. k) precision-recall curves for the validation datasets (Mayo and UPenn), which consisted of 2 classes (control/AD). In all cases shown (a-k), an SVM classifier is used with a 6-fold cross-validation strategy, and aggregated results from the test sets are shown.

