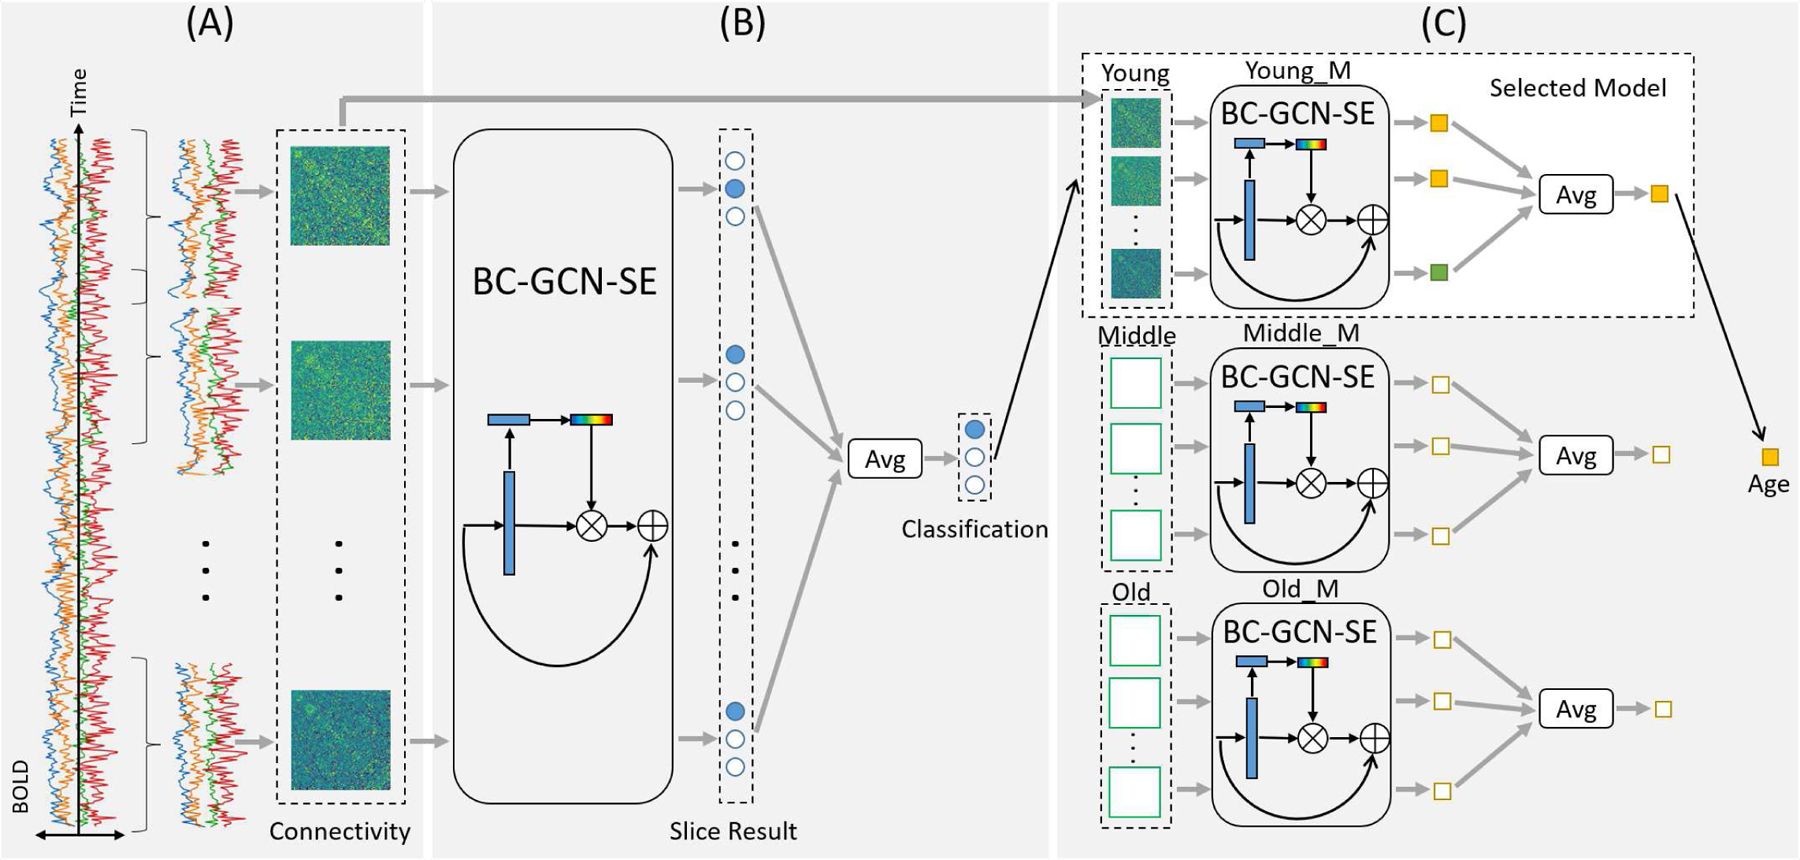
Fig. 1.

The general flowchart of our proposed framework. Input is the blood oxygen level-dependent (BOLD) signals of infants in natural rest without any explicit task engagement, and output is the predicted age of each infant. The whole process consists of three steps. Step A (data processing) calculates the dynamic brain connectivity matrices from each subject using FSLNets tool and sliding window with overlap, Step B (coarse stage) utilizes a classification model to determines the age group (young, middle or old) of subjects, and Step C (fine stage) predicts the age through the regression model (Young_M, Middle_M or Old_M) selected based on the classified age group in Step B. All the models in Step B and Step C use the connectivity matrices from Step A as input.
