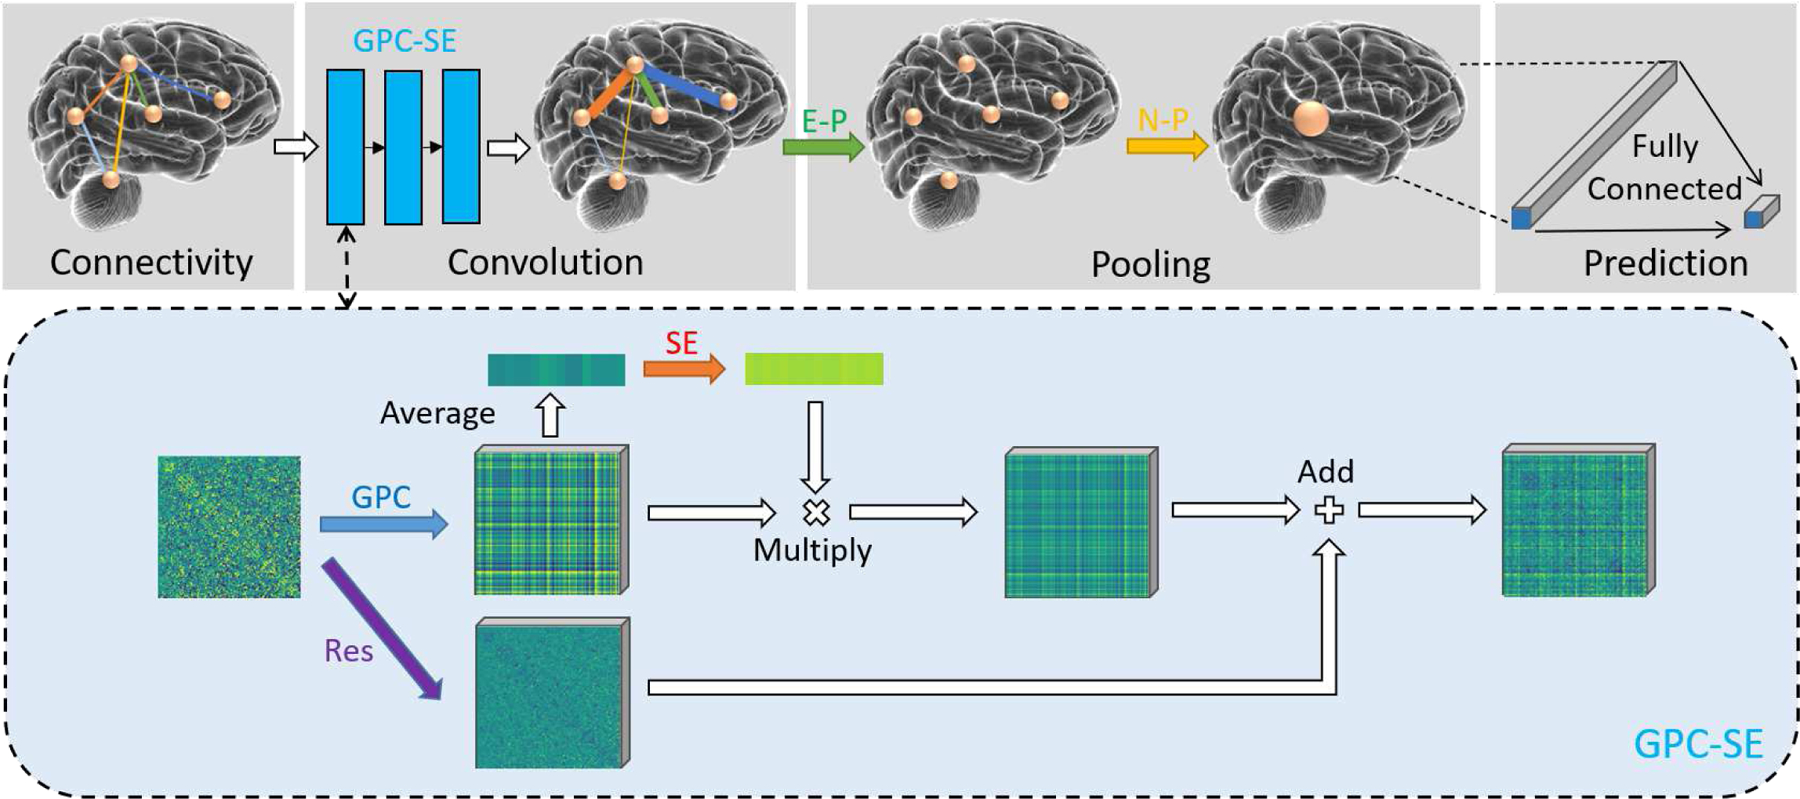
Fig. 2.

Illustration of the proposed BC-GCN-SE model. The input is a graph-like brain connectivity data, where nodes represent brain regions and edges represent function connections. Firstly three GPC-SE layers extract the features on edges, and real data changes are visualized in the dashed box. Then E-P pools data from edges to node, leaving only the node structure, and N-P pools data on edges to get a single output. Note this single output is actually a channel-number-dimensionality vector, and a fully connected layer is needed to make a final prediction.
