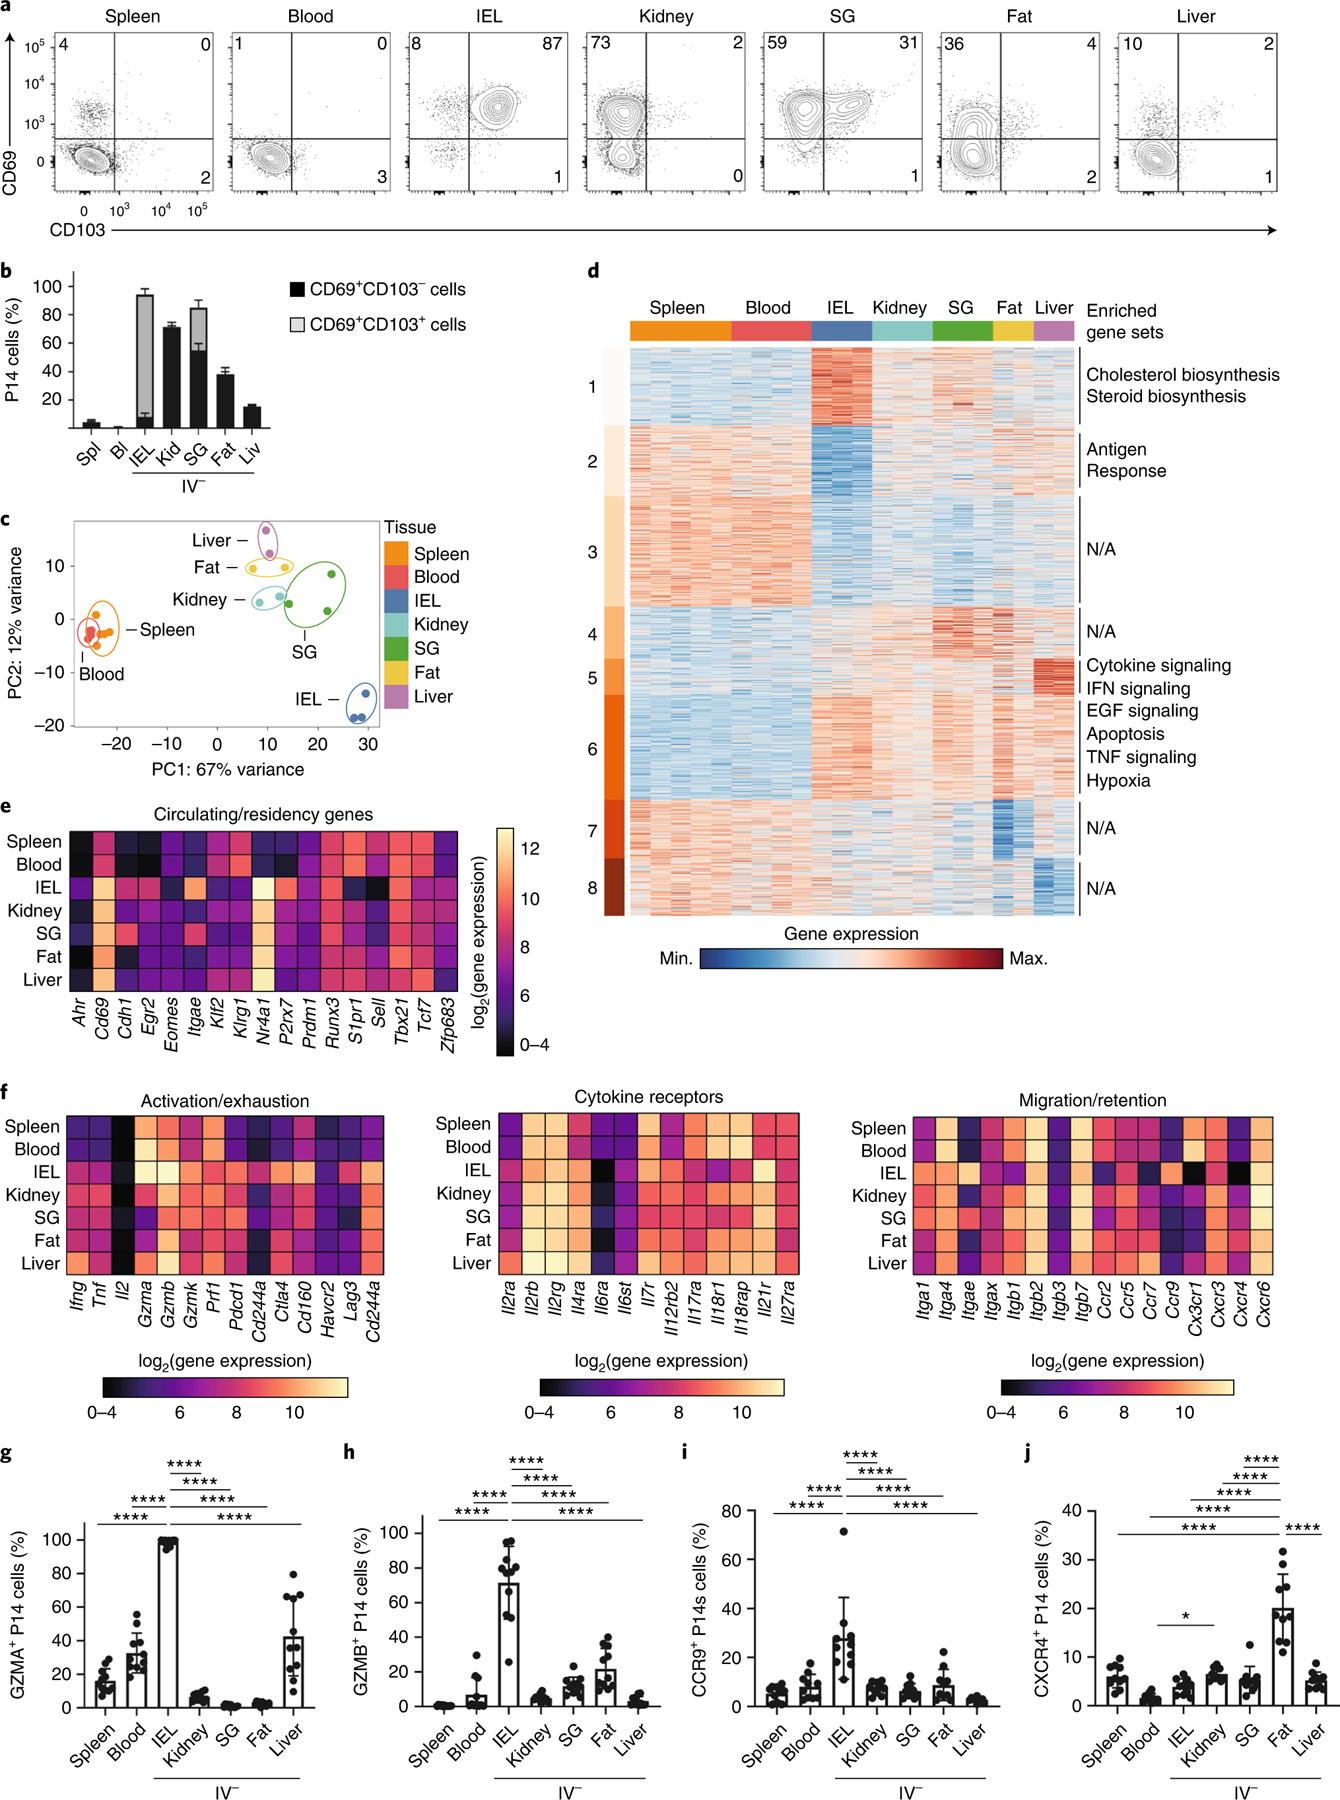
Fig. 1 |. TRM cells in distinct tissue microenvironments possess unique transcriptional programs.

a,b, Representative flow cytometry plots (a) and quantification (b) of CD69 and CD103 expression in CD8+ TRM cells isolated from IEL, kidney, SG, fat and liver. c, PCA analysis of RNA-seq of CD8+ TRM cells isolated from IEL, kidney, SG, fat and liver, as well as memory CD8+ cells from spleen and blood. Two to three experimental replicates were used per sequenced tissue sample, generated by pooling tissues from multiple mice. d, Heatmap of 2,820 DEGs from RNA-seq dataset in c, clustered with k-means = 8. Enriched gene sets are indicated on the right. EGF, Epidermal growth factor; N/A, not available. e, The log2(expression) values for select genes previously associated with circulating or tissue-resident CD8+ T cells from the RNA-seq dataset in c. f, The log2(expression) values for select genes associated with activation/exhaustion (left), cytokine receptors (center) and migration/retention (right) from the RNA-seq dataset in c. g–j, Percentage of GZMA+ (g), GZMB+ (h), CCR9+ (i) and CXCR4+ (j) P14 cells isolated from the indicated tissues as assessed by flow cytometry. Quantification of flow cytometry data in b and g–j displays the mean ± s.d. for 12 (b), 11 (g and h) or 10 (i and j) mice from 3 experimental replicates. The significance was calculated using a one-way ANOVA and corrected for multiple comparisons using Tukey’s test. ****P < 0.0001.
