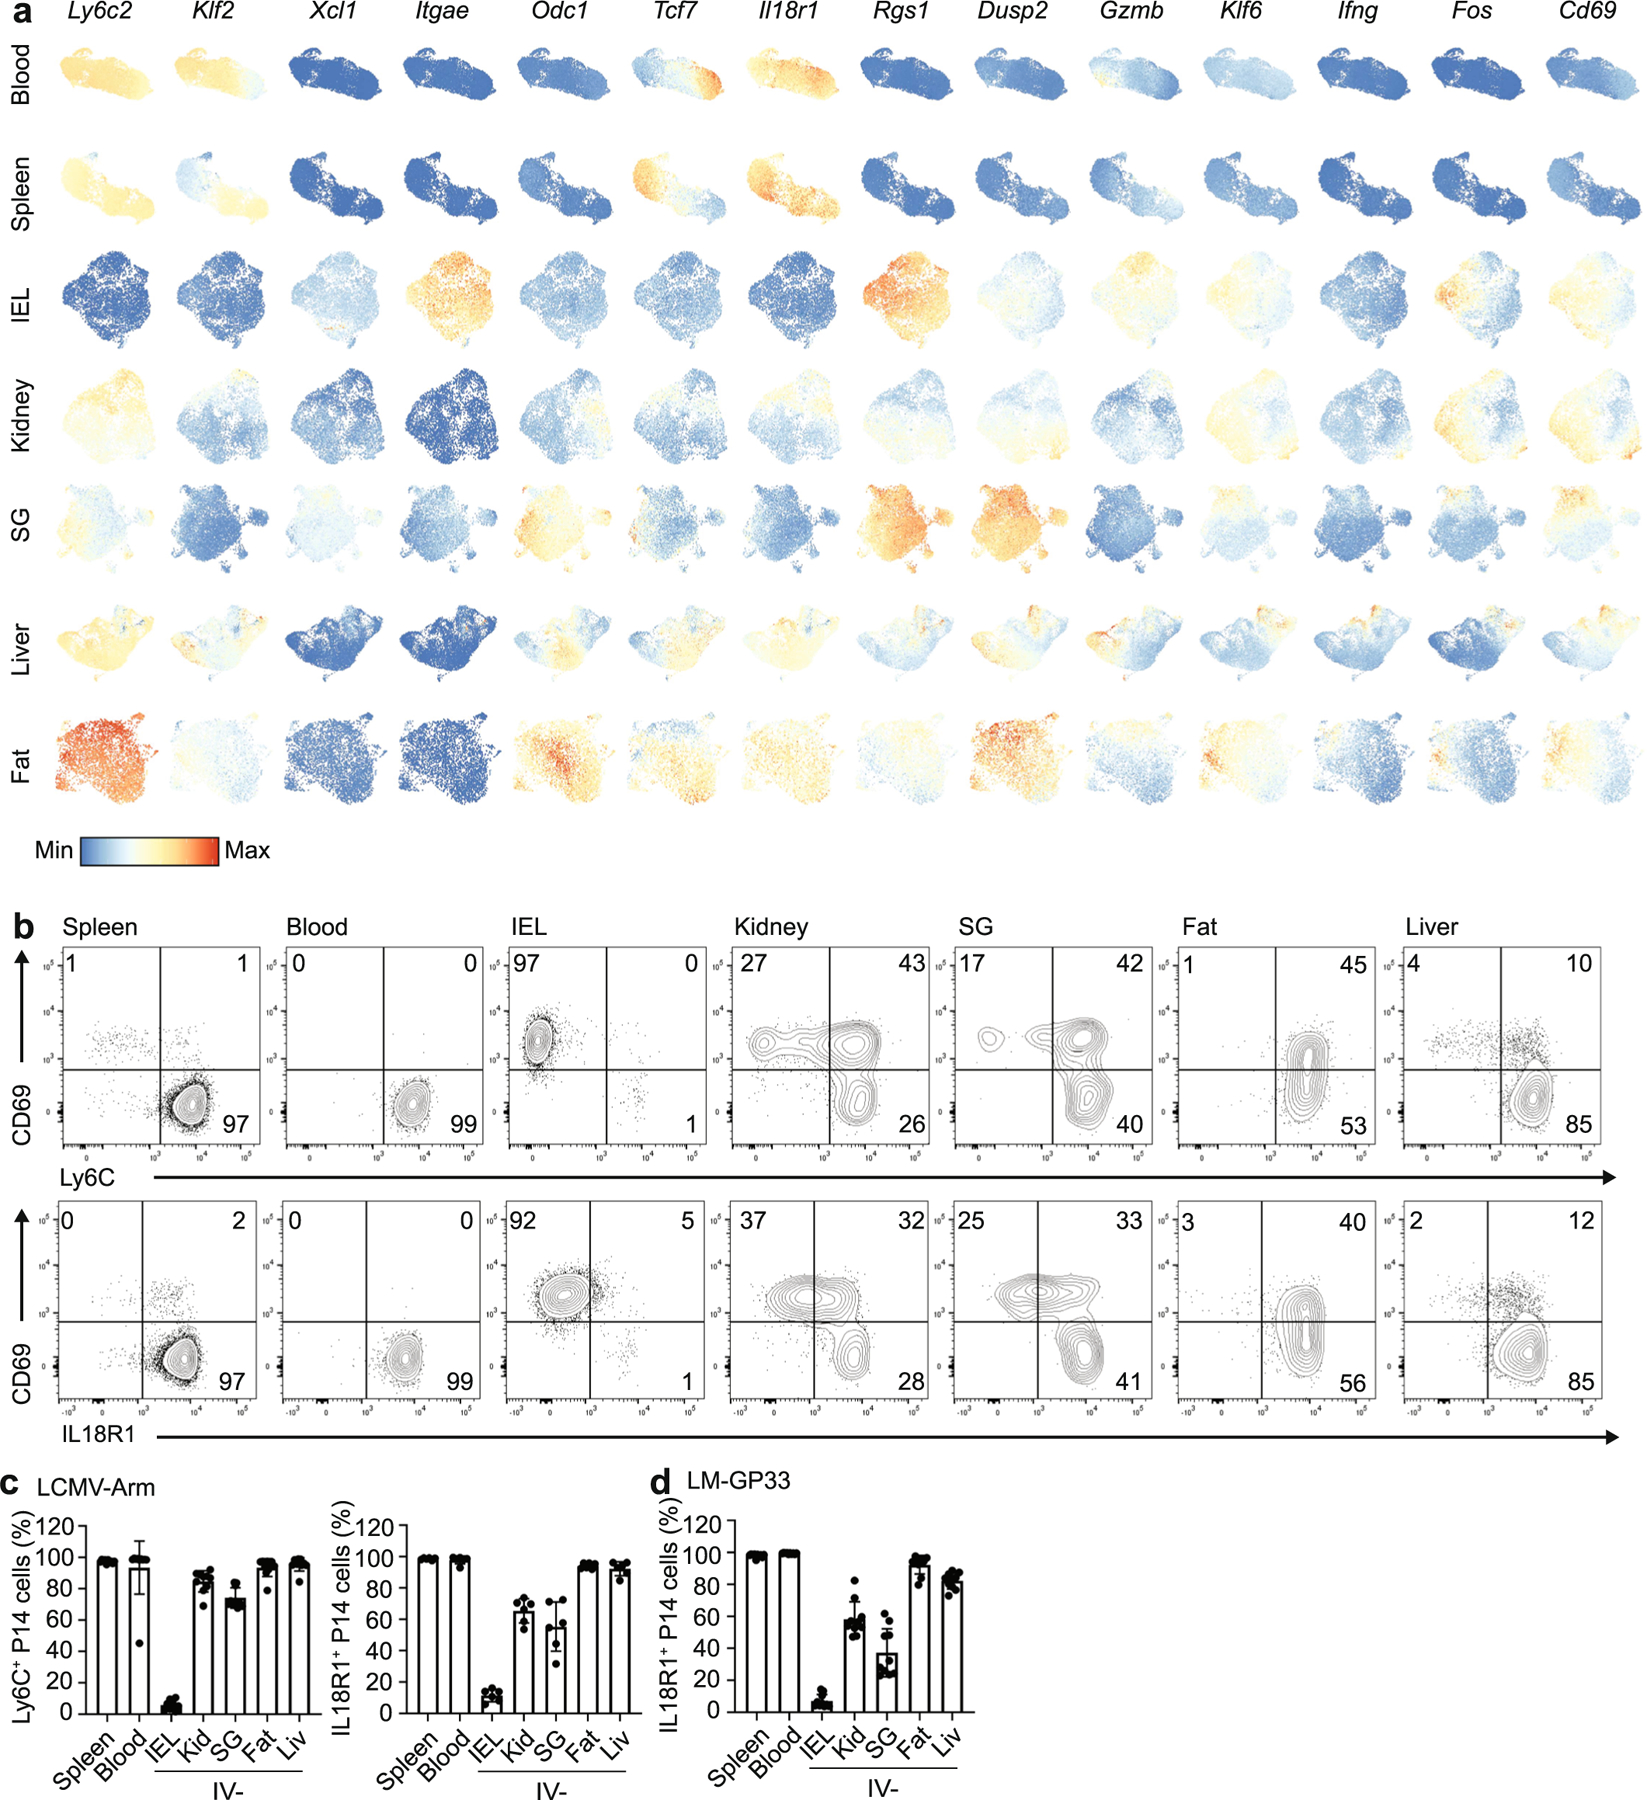
Extended Data Fig. 6 |. TRM differentiation programs are a source of intra-tissue heterogeneity.

a, UMAP dimensional reduction of scRNA-sequencing of TRM separated by tissue. Cells were colored by the expression of the indicated genes. Scales are consistent across tissues to allow for comparison within and among tissues. b-c, Expression of CD69, Ly6C, IL18R1 on P14 cells harvested 30–40 days after initial infection with LCMV. Representative flow cytometry plots (b) and quantification (c). d, Quantification of IL18R1 expression on P14 cells harvested from the indicated tissues 30–40 days after initial infection with LM-GP33. Quantification of flow cytometry data in c and d displays the mean ± SD for 6 (c) 10 (d) mice from 2 experimental replicates.
