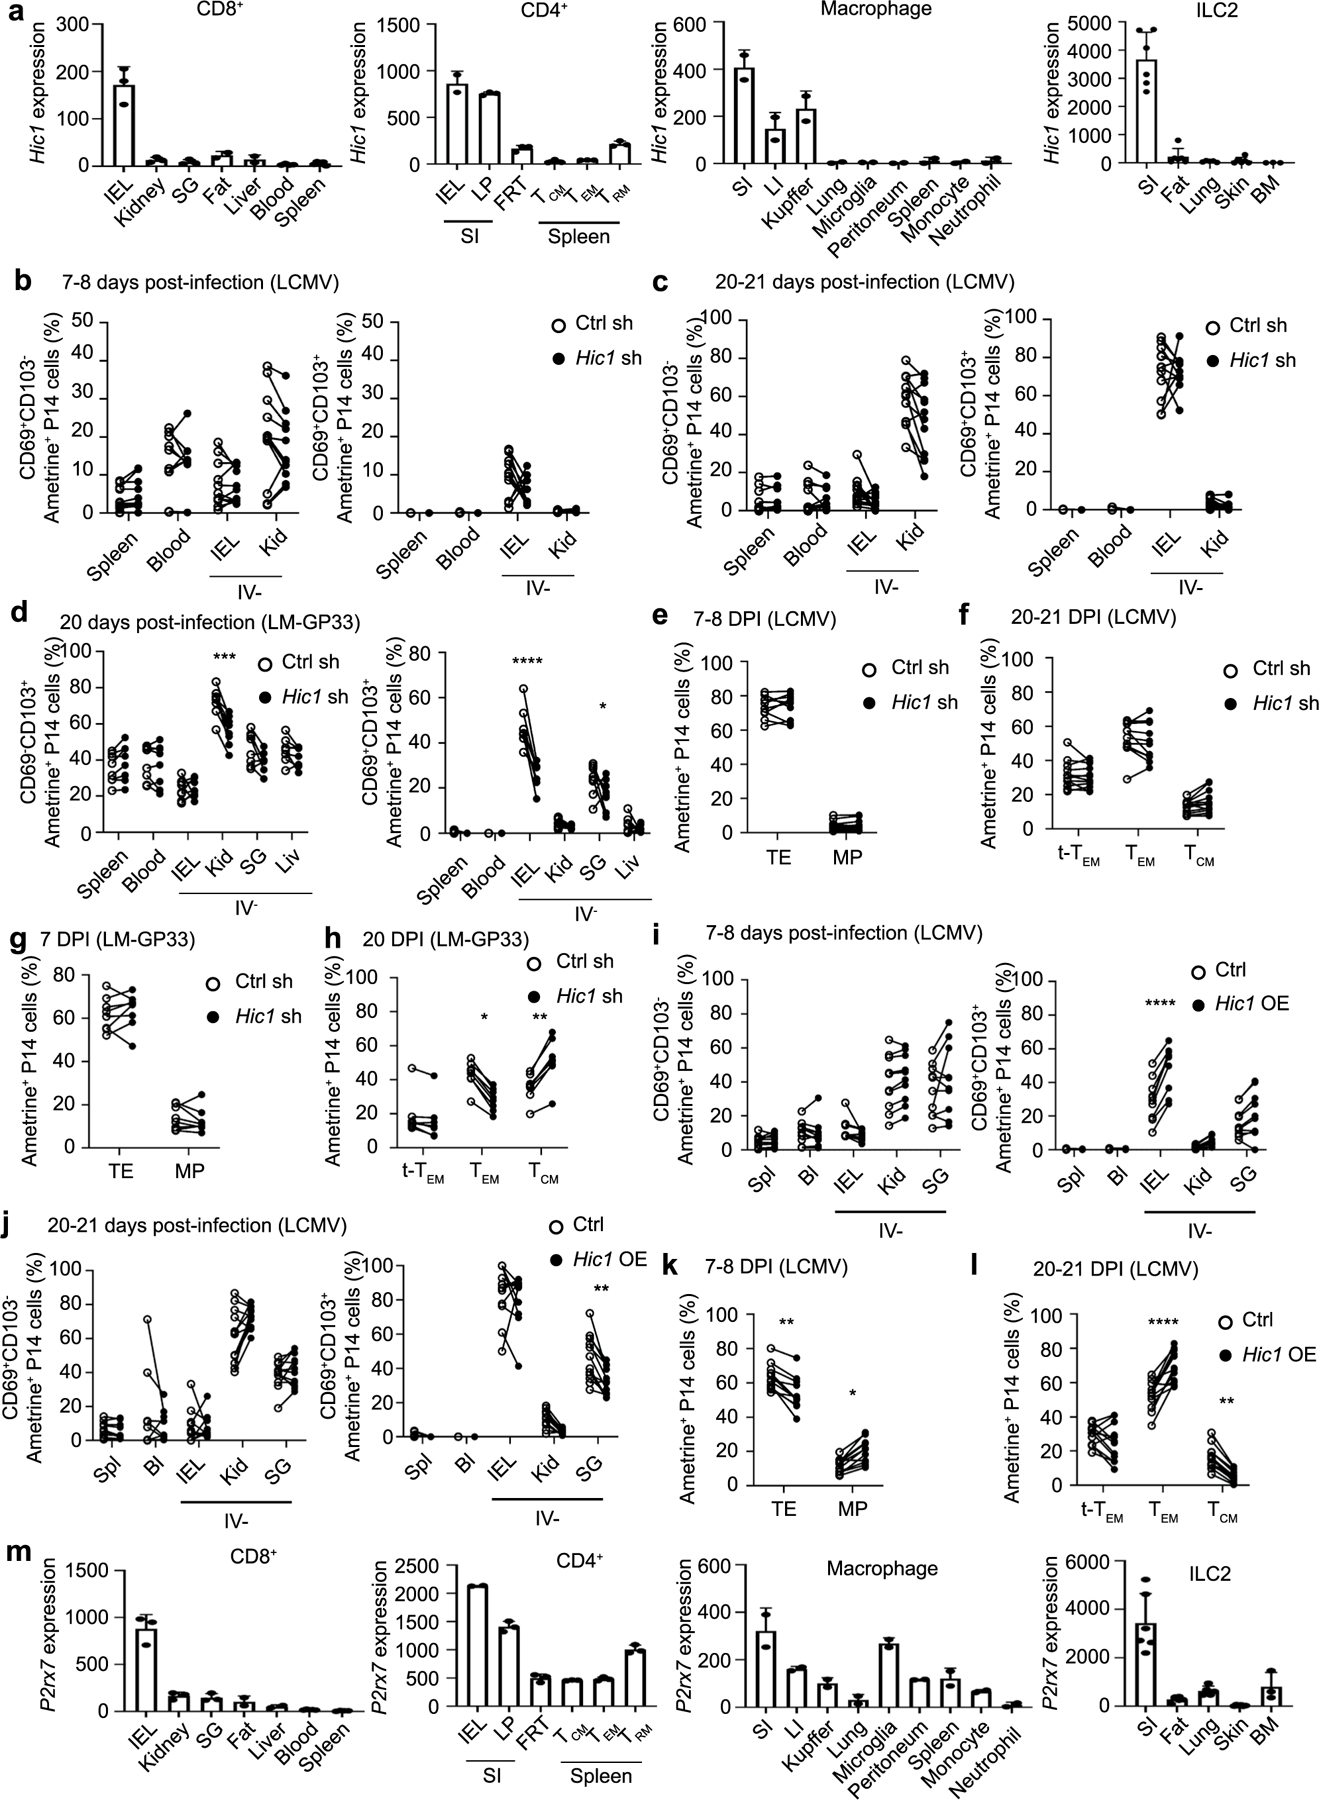
Extended Data Fig. 9 |. Hic1 is critical for the differentiation of small intestine TRM.

a, Hic1 expression by resident immune cell populations isolated from the indicated tissues. b-g, 1:1 mixed transfer of P14 cells transduced with a control shRNA or a Hic1-targeting shRNA. b-c, Percentage of P14 cells that are CD69+CD103− (left) or CD69+CD103+ (right) on day 7–8 (b) or day 20–21 post-infection with LCMV (c). d, Percentage of P14 cells that are CD69+CD103− (left) or CD69+CD103+ (right) on day 20 post-infection with LM-GP33. e, Percentage of P14 cells that were terminal effectors (TE, KLRG1+CD127−) or memory precursors (MP, KLRG1−CD127+) on day 7–8 post-infection with LCMV. f, Percentage of P14 cells that are terminal effector memory (tTEM, CD127-CD62L-), effector memory (TEM, CD127+CD62L-), or central memory (TCM, CD127+CD62L+) on day 20–21 post-infection with LCMV. g-h, Percentage of P14 cells that were TE or MP on day 7 (g) or day 20 (h) after infection with LM-GP33. i-l, 1:1 mixed transfer of P14 cells transduced with a control vector or a Hic1-overexpression vector. i-j, Percentage of P14 cells that are CD69+CD103− (left) or CD69+CD103+ (right) on day 7–8 (i) or day 20–21 (j) post-infection with LCMV. k, Percentage of P14 cells that were TE or MP on day 7–8 post-infection with LCMV l, Percentage of P14 cells that were tTEM, TEM, or TCM on day 20–21 post-infection with LCMV. m, P2xr7 expression by resident immune cell populations isolated from the indicated tissues. Graphs in a and m display mean ± SD for the expression values from RNA-Seq samples (22 samples for CD8+, 17 samples for CD4+, 18 samples for Macrophages, 26 samples for ILC2). Graphs in b, c, e, f, il display mean ± SD for 11 mice from 3 experimental replicates. Graphs in d, g, and h display mean ± SD for 8 mice from 2 individual experiments. Significance calculated with a two-way ANOVA using with Sidak’s multiple comparison test. *p < 0.05, **p < 0.01, ***p < 0.001, ****p < 0.0001.
