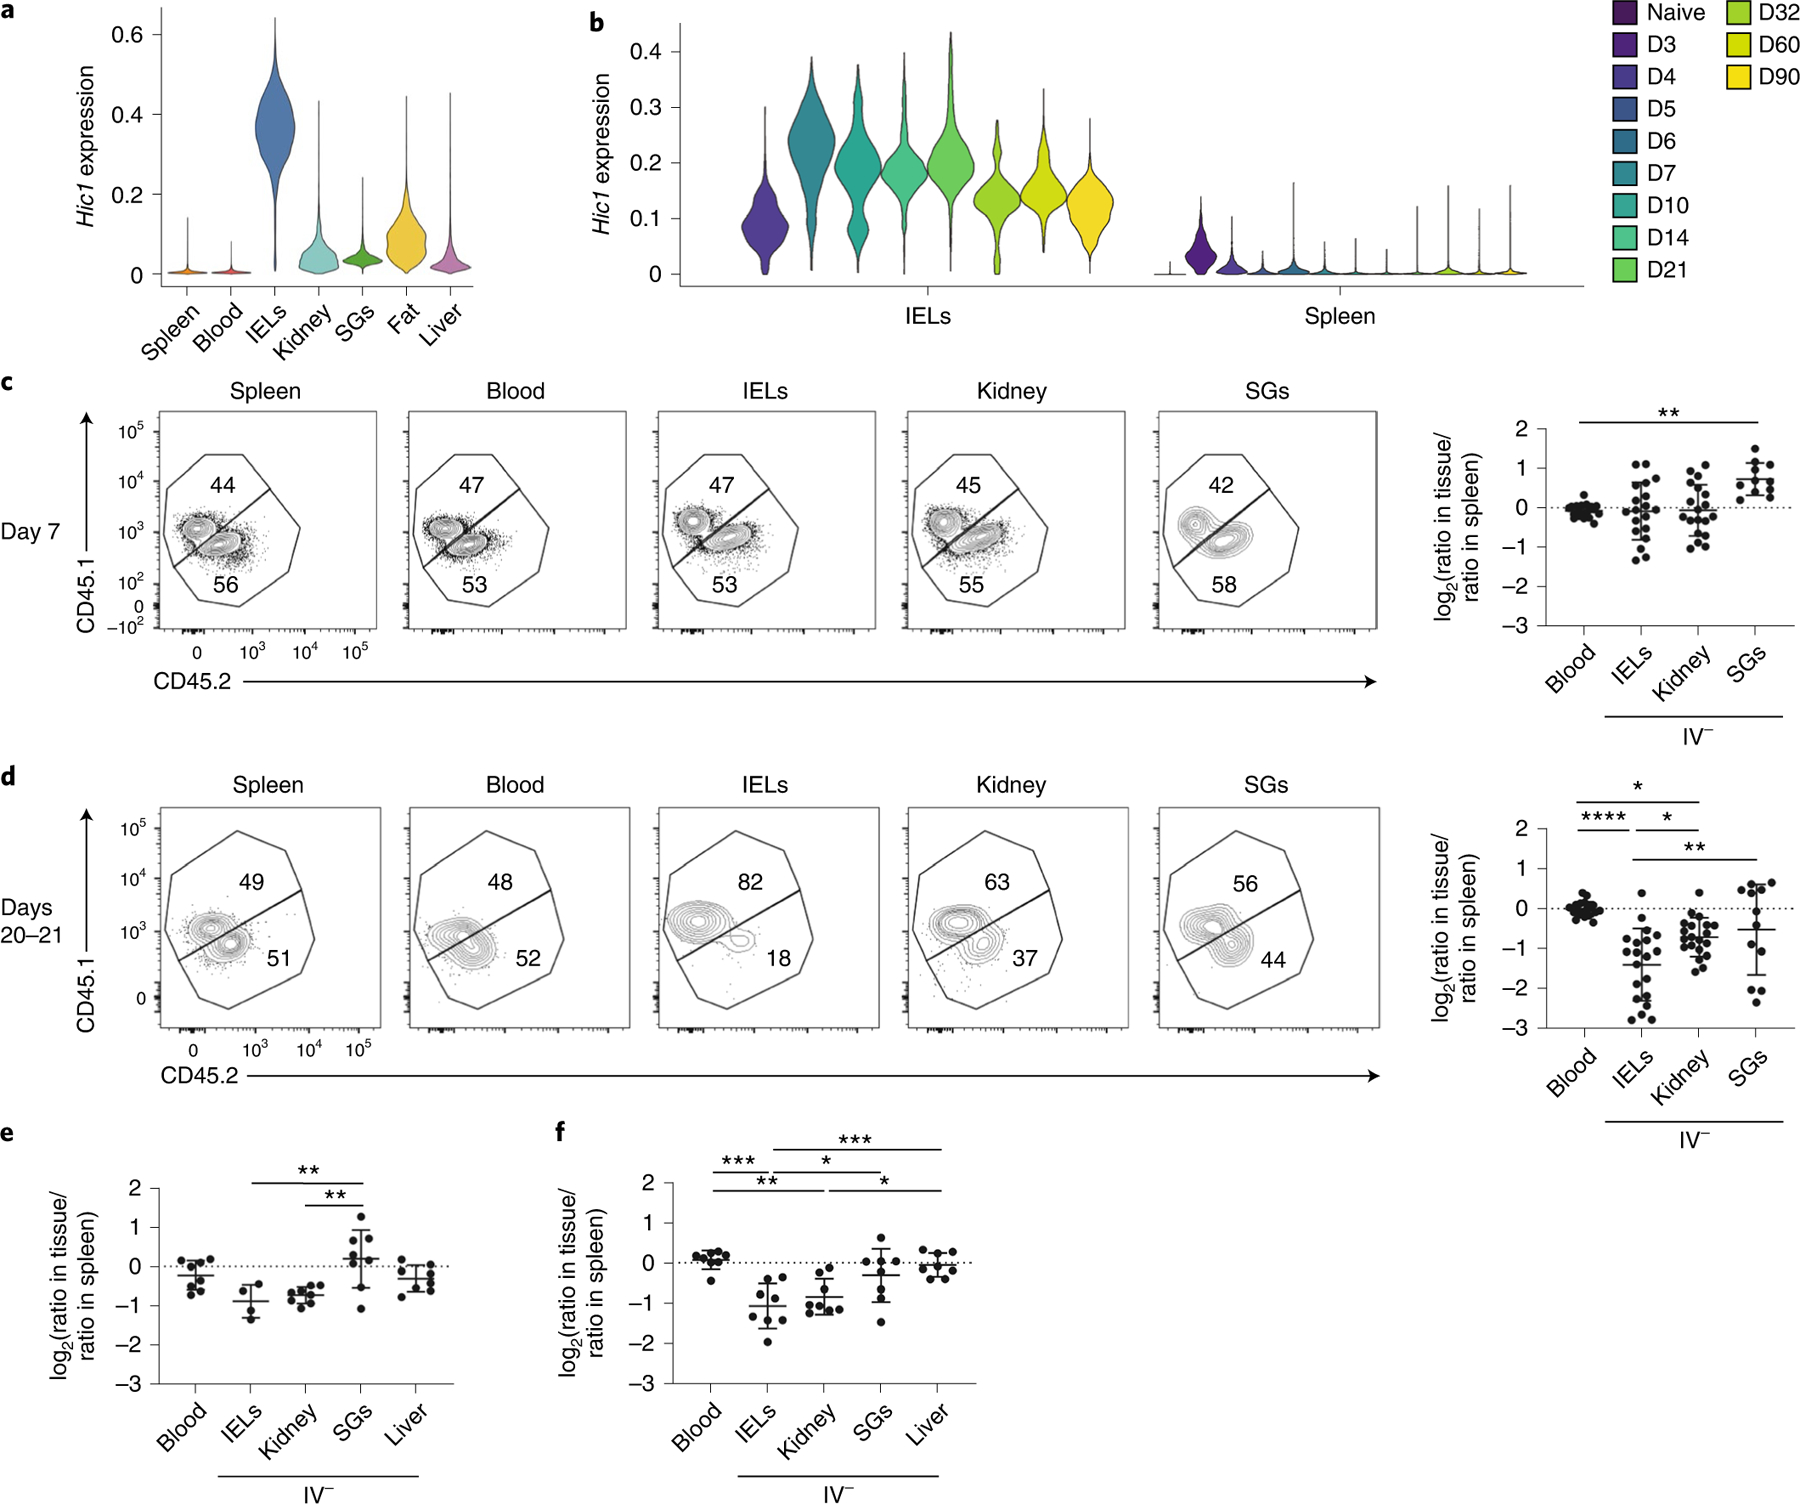
Fig. 5 |. Loss of Hic1 prevents the formation of SI TRM cells.

a, Violin plots displaying Hic1 expression after MAGIC imputation in scRNA-seq data from Fig. 2. b, Hic1 expression in scRNA-seq dataset from Kurd et al.7. The violin plot is colored by time after infection with LCMV. D, Day. c–f, A 1:1 mixed transfer of P14 cells transduced with a control shRNA or a Hic1-targeting shRNA before infection with LCMV or LM-GP33. Representative flow cytometry plot (Ctrl CD45.1, Hic1 KD CD45.1.2) (left) and quantification (right) of the relative ratios between Hic1-targeting and control shRNAs are normalized to the spleen on days 7–8 (c) or 20–21 (d) after initial infection with LCMV. e,f, Quantification of the relative ratios between Hic1-targeting and control shRNAs normalized to the spleen on day 7 (e) or day 20 (f) after initial infection with LM-GP33. Graphs in c and d display the mean ± s.d. for 19 mice from 5 separate experiments for blood, spleen, IEL and kidney, and 11 mice from 3 experiments for SG. Graphs in e and f display the mean ± s.d. for eight mice from two separate experiments. The significance was calculated using a one-way ANOVA and corrected for multiple comparisons using Tukey’s test. *P < 0.05, **P < 0.01, ***P < 0.001, ****P < 0.0001.
