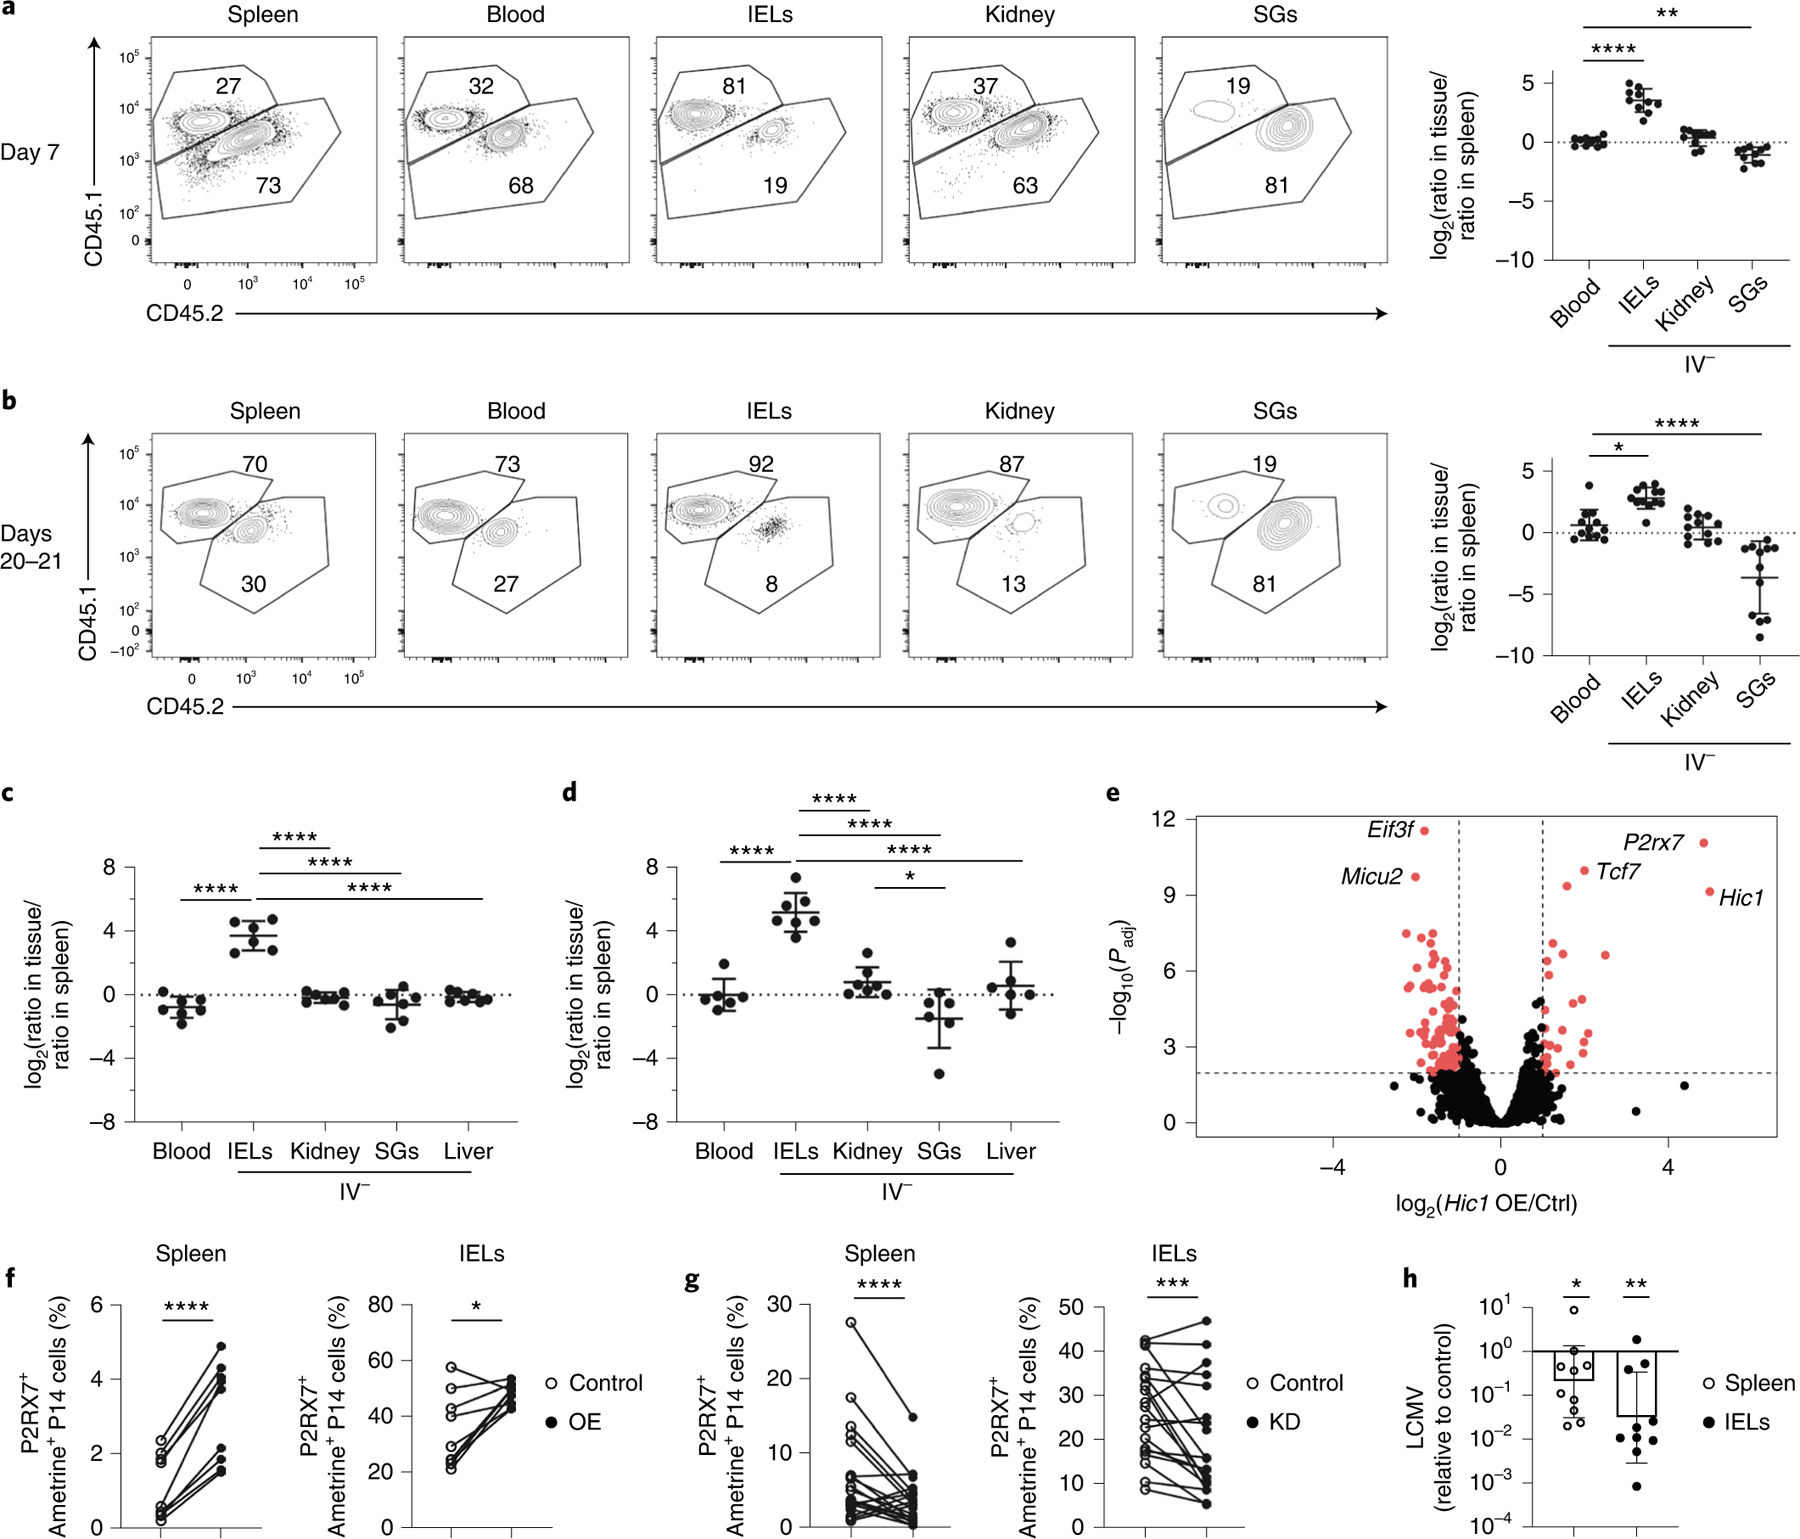
Fig. 6 |. Hic1 overexpression enhances the formation of SI TRM. cells.

a–d, A 1:1 mixed transfer of P14 cells transduced with a control or a Hic1-overexpression construct before infection with LCMV or LM-GP33. Representative flow cytometry plot (Ctrl CD45.1.2, Hic1 KD CD45.1) (left) and quantification (right) of the relative ratios between Hic1 and control-transduced P14 cells are normalized to the spleen on days 7–8 (a) or days 20–21 (b) after initial infection with LCMV. Quantification of the relative ratios between Hic1 and control-transduced P14 cells was normalized to the spleen on day 7 (c) or day 20 (d) after initial infection with LM-GP33. e, RNA-seq of control and Hic1-overexpressing P14 cells isolated from the spleen at day 7 post-infection with LCMV. f,g, Percentage of P2RX7+ametrine+ P14 cells isolated from the spleen (left) or IEL (right) in Hic1-overexpression at day 7 post-infection (f) and in Hic1 knockdown at day 7 post-infection (g). h, Bar plot showing LCMV expression in mice that received Hic1-overexpressing P14 cells normalized to mice receiving control P14 cells. LCMV titers were assessed by qPCR relative to HPRT. Graphs in a and b display the mean ± s.d. from 10 mice (a) and 12 mice (b) from 3 separate experiments. Graphs in c and d display the mean ± s.d. for six mice (c) and seven mice (d) from two separate experiments. Significance in a–d was calculated using a one-way ANOVA and corrected for multiple comparisons using Tukey’s test. Graphs in f display three individual experiments with three mice each. Graphs in g display mean ± s.d. for 18 mice from 4 separate experiments. Significance in f and g was calculated using a two-sided, paired Student’s t-test and connecting lines indicate that the Ctrl and Hic1 KD/OE cells were isolated from the same mouse. The graph in h displays the geometric mean ± s.d. from two different experiments with five mice each. The significance was calculated using an unpaired, two-sided Student’s t-test. *P < 0.05, **P < 0.01, ***P < 0.001, ****P < 0.0001.
