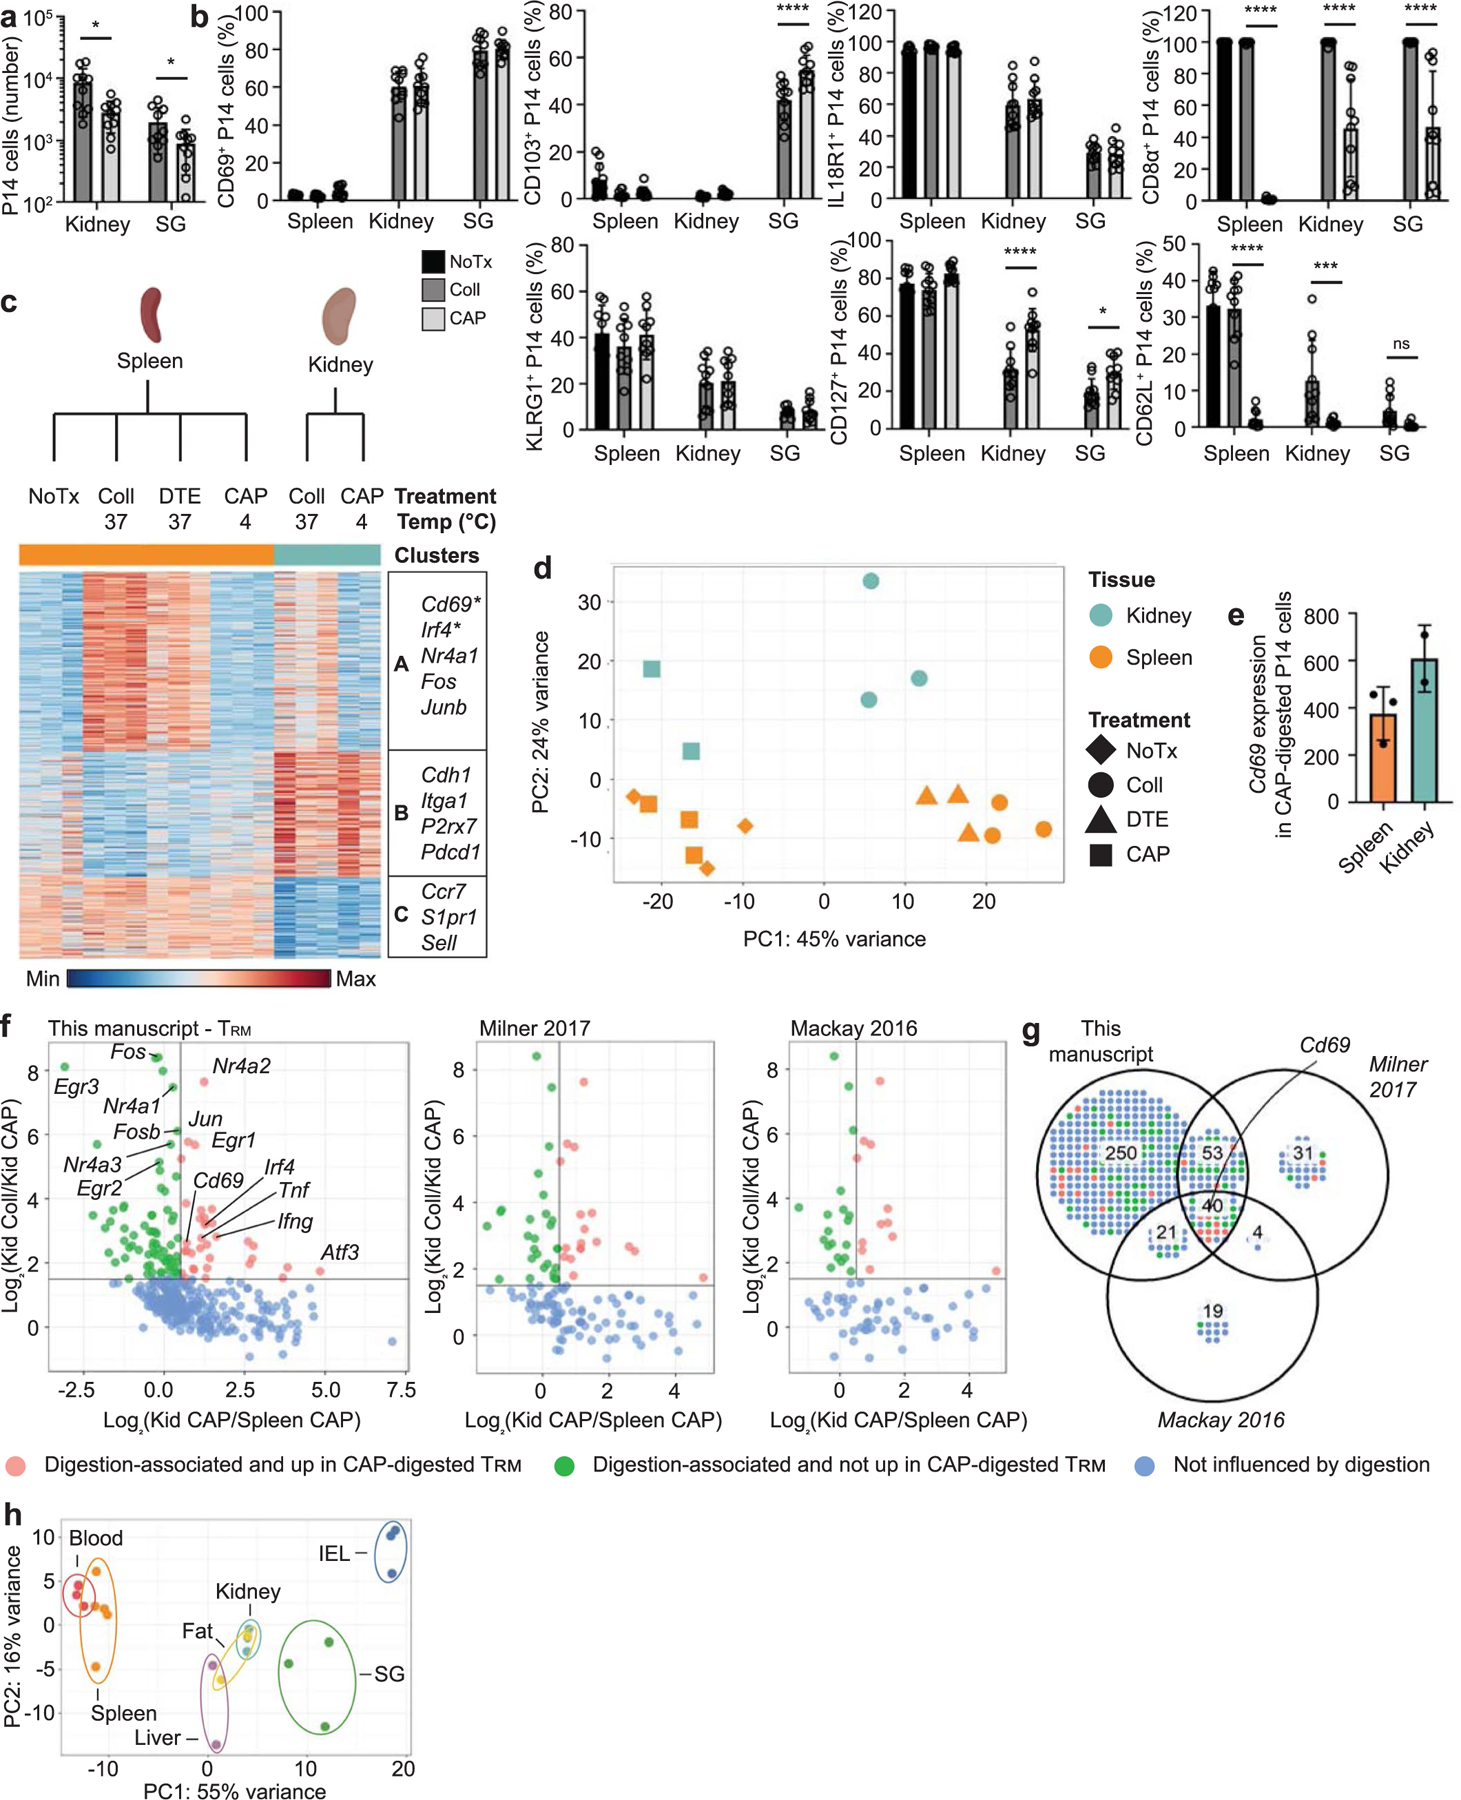
Extended Data Fig. 3 |. Collagenase digestion induces upregulation of a subset of genes also associated with tissue residency.

a-d, P14 cells were adoptively transferred into CD45 congenic hosts one day prior to infection with LCMV. 30–40 days after initial infection, P14 cells were isolated from tissues using no additional treatment (NoTx), collagenase (Coll), or a cold active protease (CAP). a, Quantification of the number of P14 cells recovered from each tissue using the indicated digestion methods. b, Percent of P14 cells expressing CD69 (top left), CD103 (top center left), IL-18R1 (top center right), CD8a (top right), KLRG1 (bottom left), CD127 (bottom center), or CD62L (bottom right) assessed by flow cytometry. c-e, RNA-sequencing of P14 cells isolated from the spleen or kidney using NoTx, Coll, dithioerythritol (DTE), or CAP. c, Differentially expressed genes (348) were clustered with k-means = 3. Select genes in each cluster displayed on the right. Genes that were upregulated in CAP-treated tissues compared to CAP-treated spleens indicated with an asterisk. d, Principal Component Analysis. e, Cd69 expression by P14 cells isolated from the spleen or kidney with CAP. f,g, Genes included in the TRM signatures from this paper (left), Milner et al, Nature 2017 (center) and Mackay et al, Science 2016 (right) were selected. f, Corresponding expression values for collagenase-digested kidney, CAP-digested kidney, and CAP-digested spleen samples were plotted. Each gene in the corresponding TRM signature is represented by a single point and colored by influence of digestion on expression. g, Venn diagram of the preceding data. h, Principal component analysis of RNA-sequencing data from Fig. 1 with all digestion-associated genes removed. Genes were considered digestion-associated if they were expressed above a minimum threshold and at >1.5 fold in collagenase-digested kidney compared to CAP-digested kidney samples. Graphs in a and b display the mean ± SD for 10 mice from 3 experimental replicates. RNA-seq data displayed in c-f contains 2–3 experimental replicates for each sample, and tissues from multiple mice were pooled. Graph in e displays the mean ± SD. Significance calculated using a two-way ANOVA and correcting for multiple comparisons using Dunnett’s test. *p < 0.05, ***p < 0.001, ****p < 0.0001.
