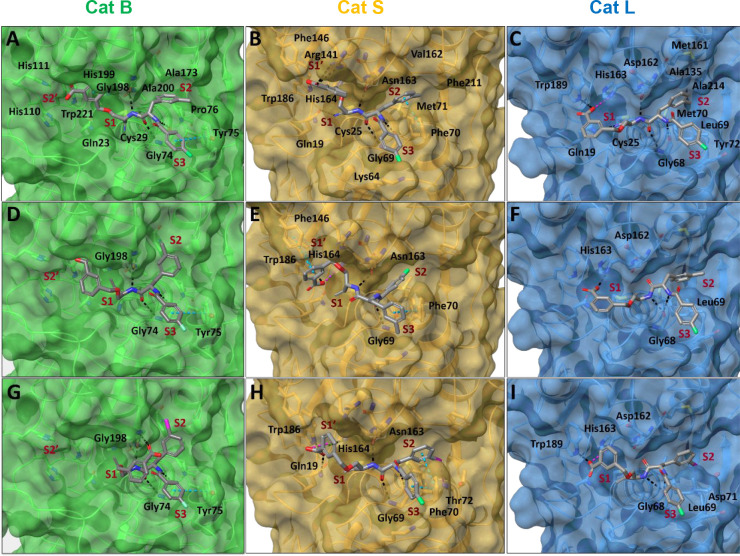
Figure 14.
Molecular models for covalent enzyme–inhibitor complexes predicted in silico. Cathepsins B, S, and L in cartoon and transparent surface representations are colored green, orange, and cyan, respectively. Interacting protein residues are shown as sticks, colored by atom type and labeled. Inhibitors (A–C) 1b, (D–F) 2b, and (G–I) 2k are shown as gray sticks and colored by atom type. Pocket binding sites S1–S3 are indicated by red labels. Intermolecular hydrogen bonds, salt bridges, π–π and halogen hydrogen bond interactions are depicted as black, magenta, cyan, and purple dashed lines, respectively. Figure generated in Maestro (Schrödinger).

