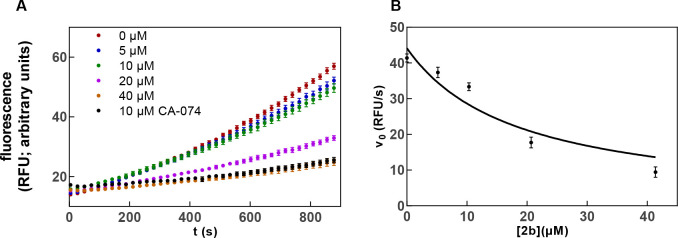
Figure 19.
(A) Increasing fluorescence intensity originating from the turnover of internally quenched substrate Abz-GIVRAK(Dnp)-NH2 shown for an examplary measurement as a duplicate determination and (B) initial velocities averaged over three measurements of v0 = f([2b]) for inhibitor 2b on viable U87-MG cells. In panel A, the primary curves show an upward curvature presumably due to the continuously secreted enzyme. Initial velocities were determined from substrate turnover curves via linear regression over the first 600 s. For panel B, analysis of v0 = f([2b]) was performed according to eq III. Measurements were performed in three independent experiments (each as duplicate determinations) in assay buffer (pH 6.0) containing 100 μM Abz-GIVRAK(Dnp)-NH2, 25 ng/mL cathepsin B, and 1.5% DMSO. Shown are mean values ± SEM.

