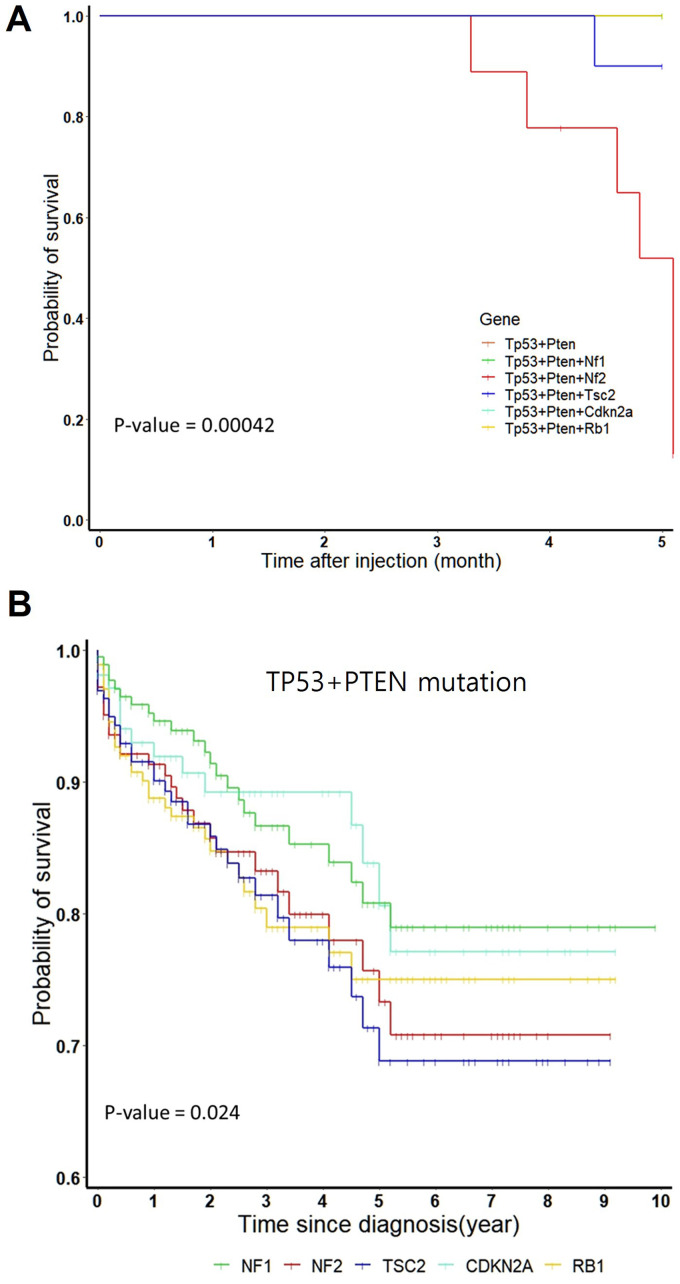
Figure 2.
Survival rates of mouse models and human cohort from the cancer genome atlas (TCGA) datasets. (A) Survival plots of mouse models with Nf1, Nf2, Tsc2, Cdkn2a, or Rb1 mutations in the Tp53 and Pten double mutation background. Significant differences in the survival rates between the six groups were examined using the log-rank test (P = 0.00042). Survival rate was significantly low in the Tp53 + Pten + Nf2 (n = 10) and Tp53 + Pten + Tsc2 (n = 10) groups. The Tp53 + Pten (n = 9), Tp53 + Pten + Nf1 (n = 10), Tp53 + Pten + Cdkn2a (n = 10), and Tp53 + Pten + Rb1 (n = 10) groups exhibited the same survival rate with overlapping survival curves. (B) Survival plots for human clinical data with low expression levels of five genes (NF1, NF2, TSC2, CDKN2A, or RB1) in the cohort with TP53 and PTEN double mutation background retrieved from TCGA database. Significance differences in the survival rates between the six groups were assessed using the log-rank test (P = 0.024, PTEN + TP53 group not shown).

