Figure 3.
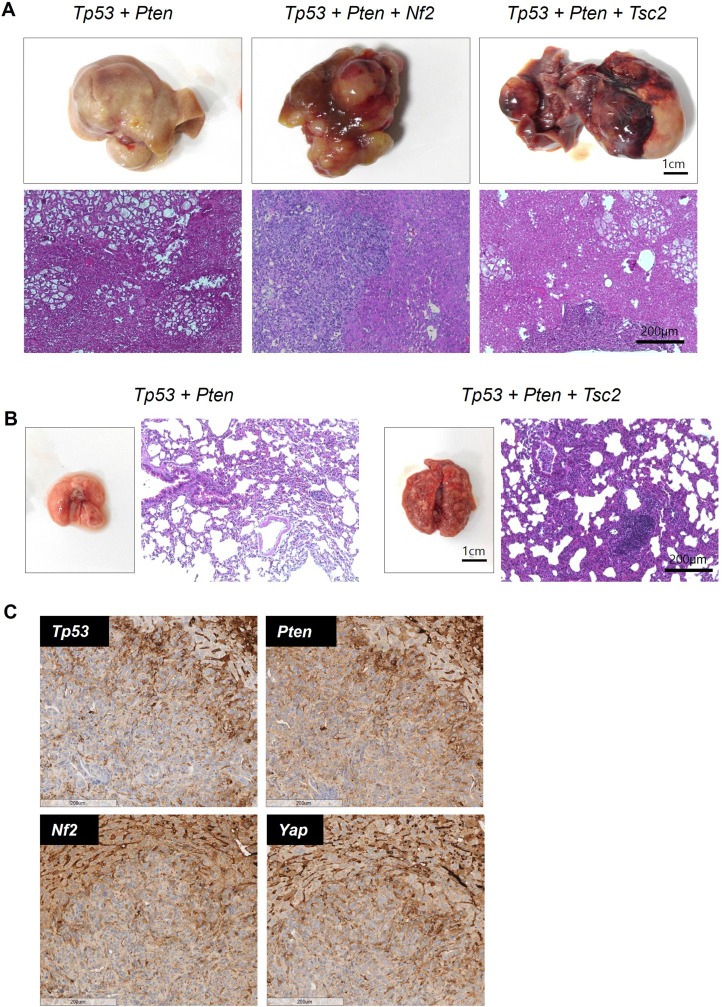
Representative images of tumors with different gene mutations. (A) Gross morphology, nodule phenotypes, and hematoxylin and eosin staining of tumors with Tp53 + Pten, Tp53 + Pten + Nf2, and Tp53 + Pten + Tsc2 mutations. (B) Gross morphology, nodule phenotypes, and hematoxylin and eosin staining of metastatic tumors with Tp53 + Pten and Tp53 + Pten + Tsc2 mutations. (C) Immunohistochemical analyses of Tp53, Pten, Nf2, and Yap1. Staining of other stromal cells in the liver served as a positive control.

