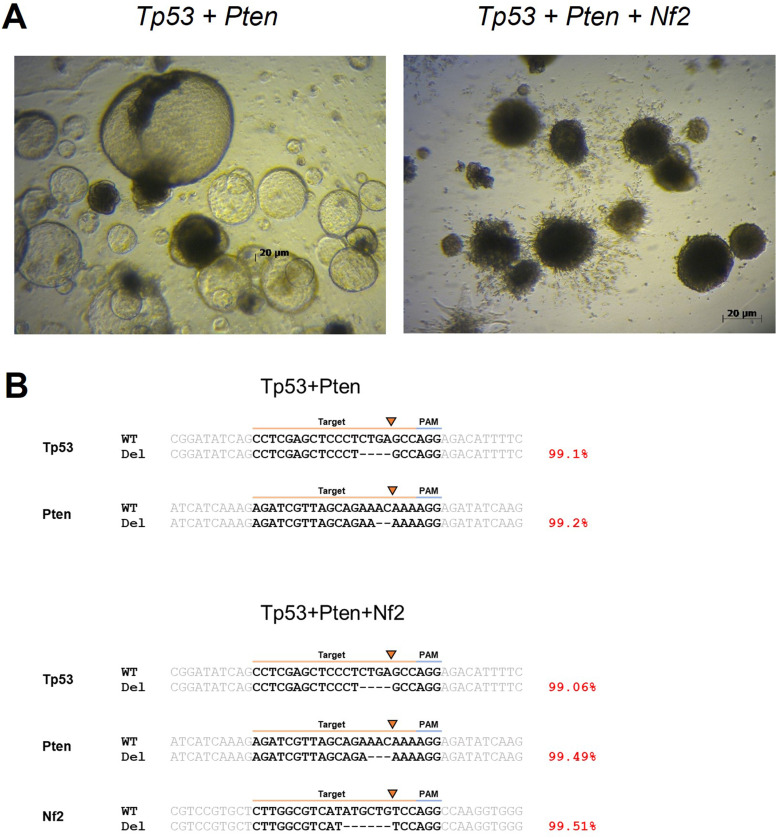
Figure 4.
Representative images of organoids. (A) Mouse liver organoids with Tp53 + Pten and Tp53 + Pten + Nf2 mutations after plating. Scale bar: 20 µm (B) Sequence analysis of representative indel patterns induced by clustered regularly interspaced short palindromic repeat-caspase 9 (CRISPR-Cas9) constructs. For each gene, the wild-type sequence is shown at the top containing the context sequence (indicated with gray text) and target sites (indicated with black text and highlighted in orange line). The PAM sequence is highlighted with a blue line. Deletions are shown as black dashes. The arrow indicates the cut site of the CRISPR-Cas9 construct. The mutation frequencies are shown on the right.

