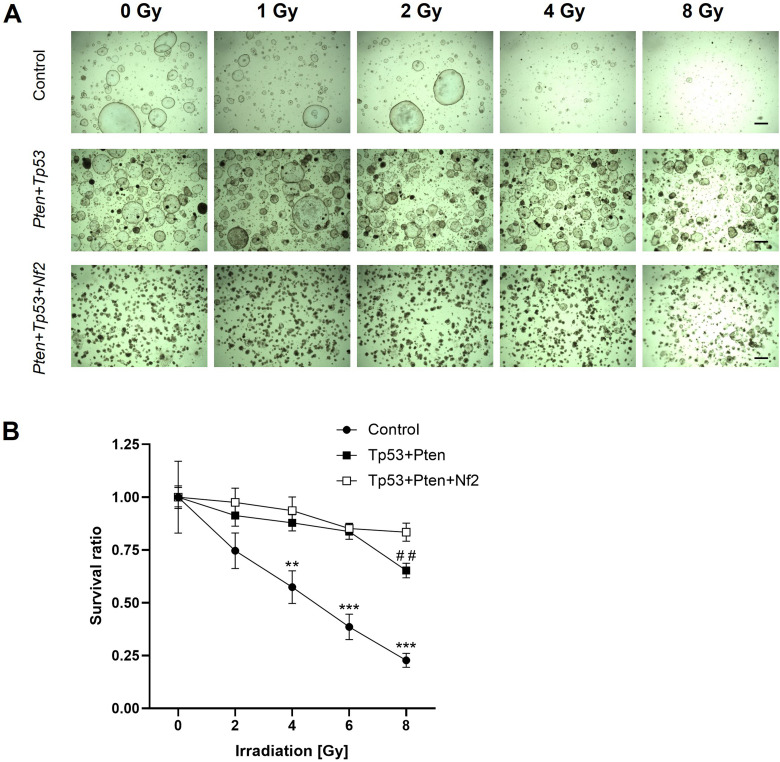
Figure 5.
Organoids exhibit differential sensitivity to radiation. (A) Representative bright-field images of the organoids exposed to radiation at the indicated doses for 7 days are shown. Scale bar: 20 µm (B) Cell survival rate was recorded at day 7 post-irradiation. This experiment was repeated two times in triplicate. The results are expressed as mean ± standard error. **P < 0.01, ***P < 0.001 (control vs Tp53 + Pten or Tp53 + Pten + Nf2) and ##P < 0.01 (Tp53 + Pten vs Tp53 + Pten + Nf2). This experiment was repeated two times in triplicate.

