Figure 4.
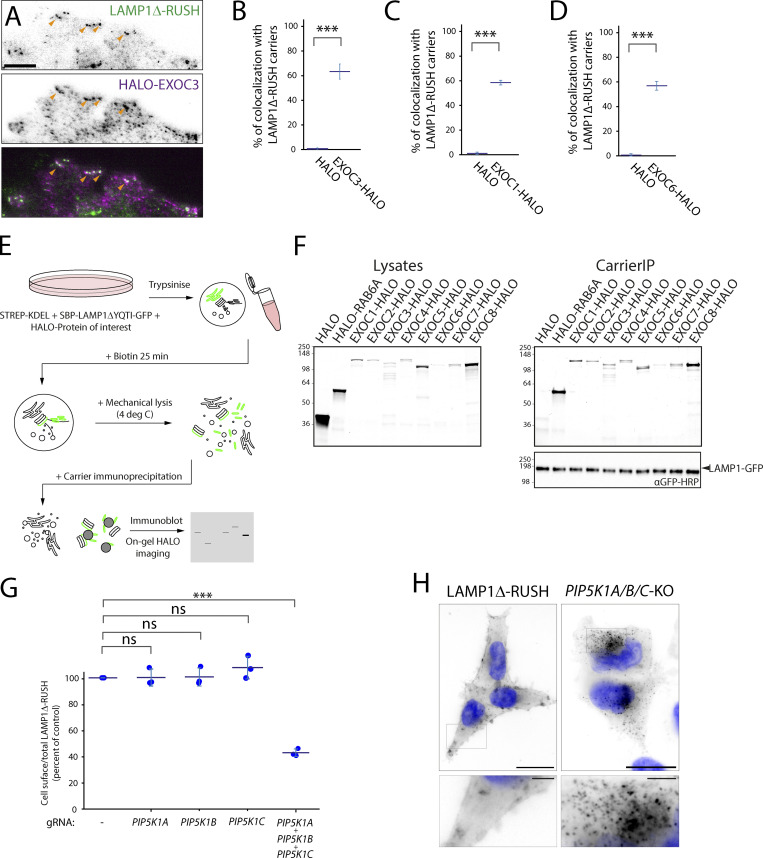
Exocyst is recruited to post-Golgi carriers and multiple associated proteins are essential. (A) TIRF imaging of heterologous expression of EXOC3-HALO in EXOC3-KO LAMP1Δ-RUSH cells. EXOC3-HALO (magenta) specifically co-localizes with LAMP1Δ-RUSH (green) carriers near the plasma membrane. Orange arrowheads indicate co-localizing structures. From Video 9. Scale bar: 5 μm. (B) Percent of LAMP1Δ-RUSH carriers positive for EXOC3-HALO, untagged HALO as a control, three biological repeats (total carriers quantified within 3 μm of plasma membrane edge = 298), statistical analysis = two-tailed t test. (C) Percent of LAMP1Δ-RUSH carriers positive for EXOC1-HALO, untagged HALO as a control, three biological repeats (total carriers quantified within 3 μm of plasma membrane edge = 228), statistical analysis = two-tailed t test. (D) Percent of LAMP1Δ-RUSH carriers positive for HALO-EXOC6, untagged HALO as a control, three biological repeats (total carriers quantified within 3 μm of plasma membrane edge = 206), statistical analysis = two-tailed t test. (E) Schematic representation of RUSH carrierIP assay. (F) Gels containing resolved proteins from carrierIP assay denoting enrichment of exocyst subunits (HALO-tagged EXOC1, EXOC2, EXOC3, EXOC4, EXOC5, EXOC6, EXOC7, and EXOC8) in LAMP1Δ-RUSH post-Golgi carriers (LAMP1 immunoblot). Molecular weight markers are indicated in kD. (G) Cell-surface ratio quantification (flow cytometry) showing reduced amounts of LAMP1Δ-RUSH at the plasma membrane after transient KO of PIP5K homologs and 35 min of biotin exposure. (H) Widefield imaging of LAMP1Δ-RUSH reporter in triple PIP5K1A/B/C KO cells 1 h after biotin addition. When compared to WT, KO cells show accumulation of post-Golgi LAMP1Δ-RUSH carriers. Scale bar: 20 μm; insert: 4 μm. Nucleus stain = DAPI. Error bar = SD of at least three independent experimental repeats. Student’s t test was performed on data in B, C, and D, and Tukey’s multiple comparisons test (HSD, FWER = 0.05) was performed on data in G. ***P ≤ 0.001.

