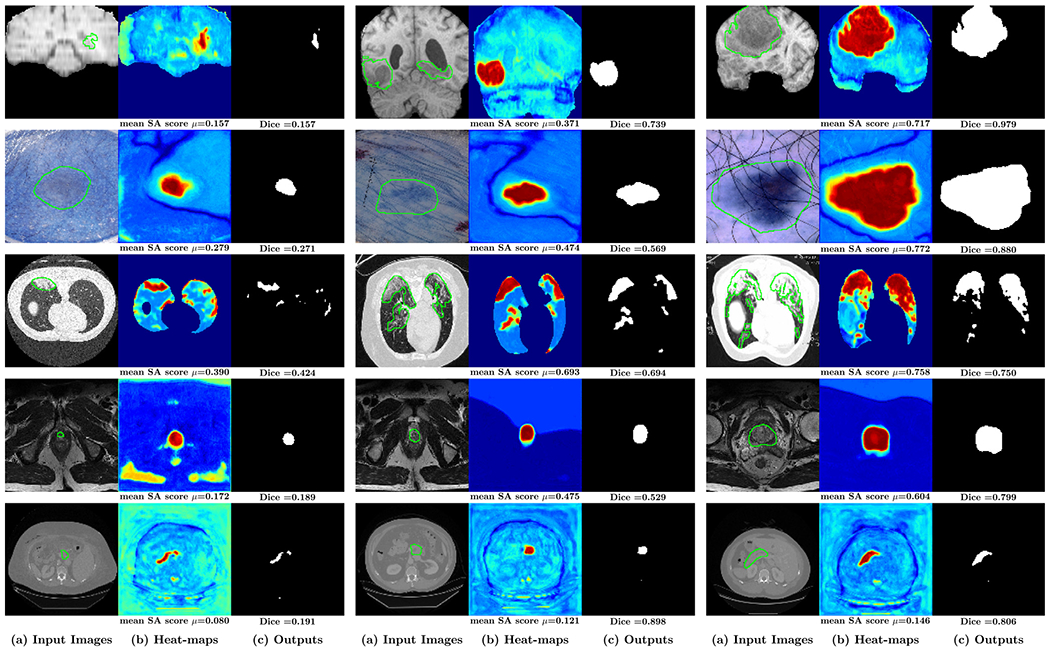
Fig. 13.

Examples of the (a) input images (with ground-truth highlighted with green contours), the corresponding (b) heat-maps computed based on the segmentation of units on last two years and (c) outputs of neural network. The corresponding mean SA score and Dice score are shown on the bottom of each image.
