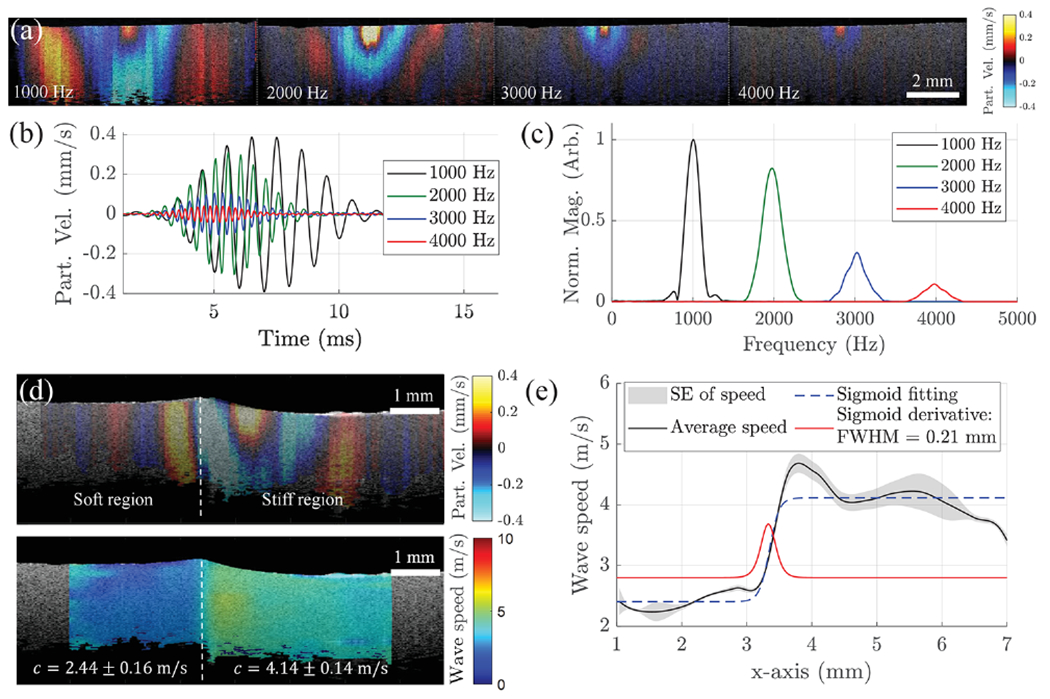
Fig. 2.

Phantom studies and elastography resolution characterization. (a) Particle velocity snapshots of wave propagation in a 3.5% w/w agar phantom when the ACUS transducer is excited at 1, 2, 3, and 4 kHz. (b) Comparison of filtered motion profiles extracted at the excitation region in (a). (c) Frequency content of excitation plots in (b). (d) Top: particle velocity snapshot of wave propagation in a two-sided agar phantom: 1.5% (left), 3.5% (right); bottom: wave speed map (in m/s) of the phantom at top. (e) Speed transition calculated from the two-sided phantom in (d). Sigmoid fitting and its derivate show a lateral speed resolution of 0.21 mm.
