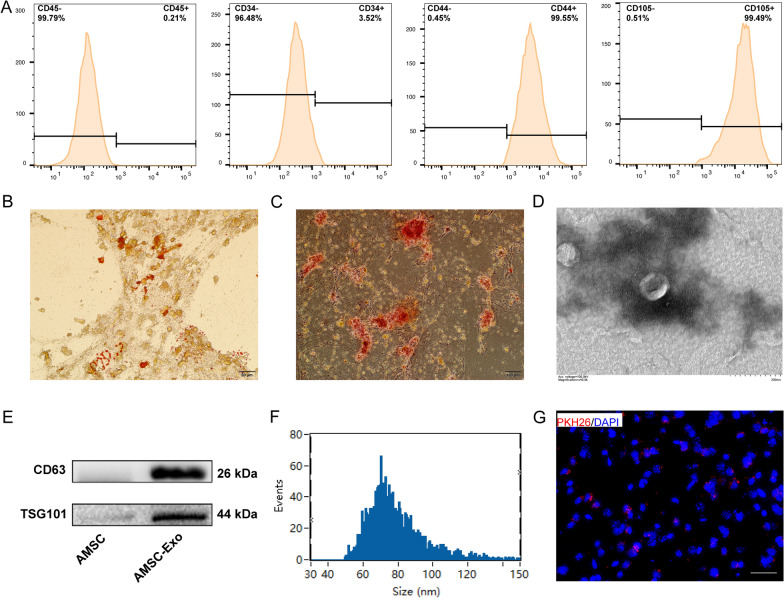
Fig. 2.
Characterization of ADSCs and ADSC-Exo. A Flow cytometric analysis of ADSCs surface markers CD44 and CD105, and negative markers CD45 and CD34. B Oil Red O staining showed a large number of red oil droplets in the cytoplasm (white arrows). Scale bars = 50 μm C. Alizarin red staining showed the red calcium nodules (white arrows) formed in cells. Scale bars = 100 μm D Representative TEM image of ADSC-Exo (white arrows). Scale bars = 200 nm. E Expressions of the ADSC-Exo markers CD63 and TSG101 were confirmed by Western blot. F Size distribution of ADSC-Exo measured by NanoFCM. G PKH‐26 labeled ADSC-Exo (Red) were detected around the nucleus (Blue) in the ipsilateral hemisphere of MCAO mice brain. Scale bars = 20 μm

