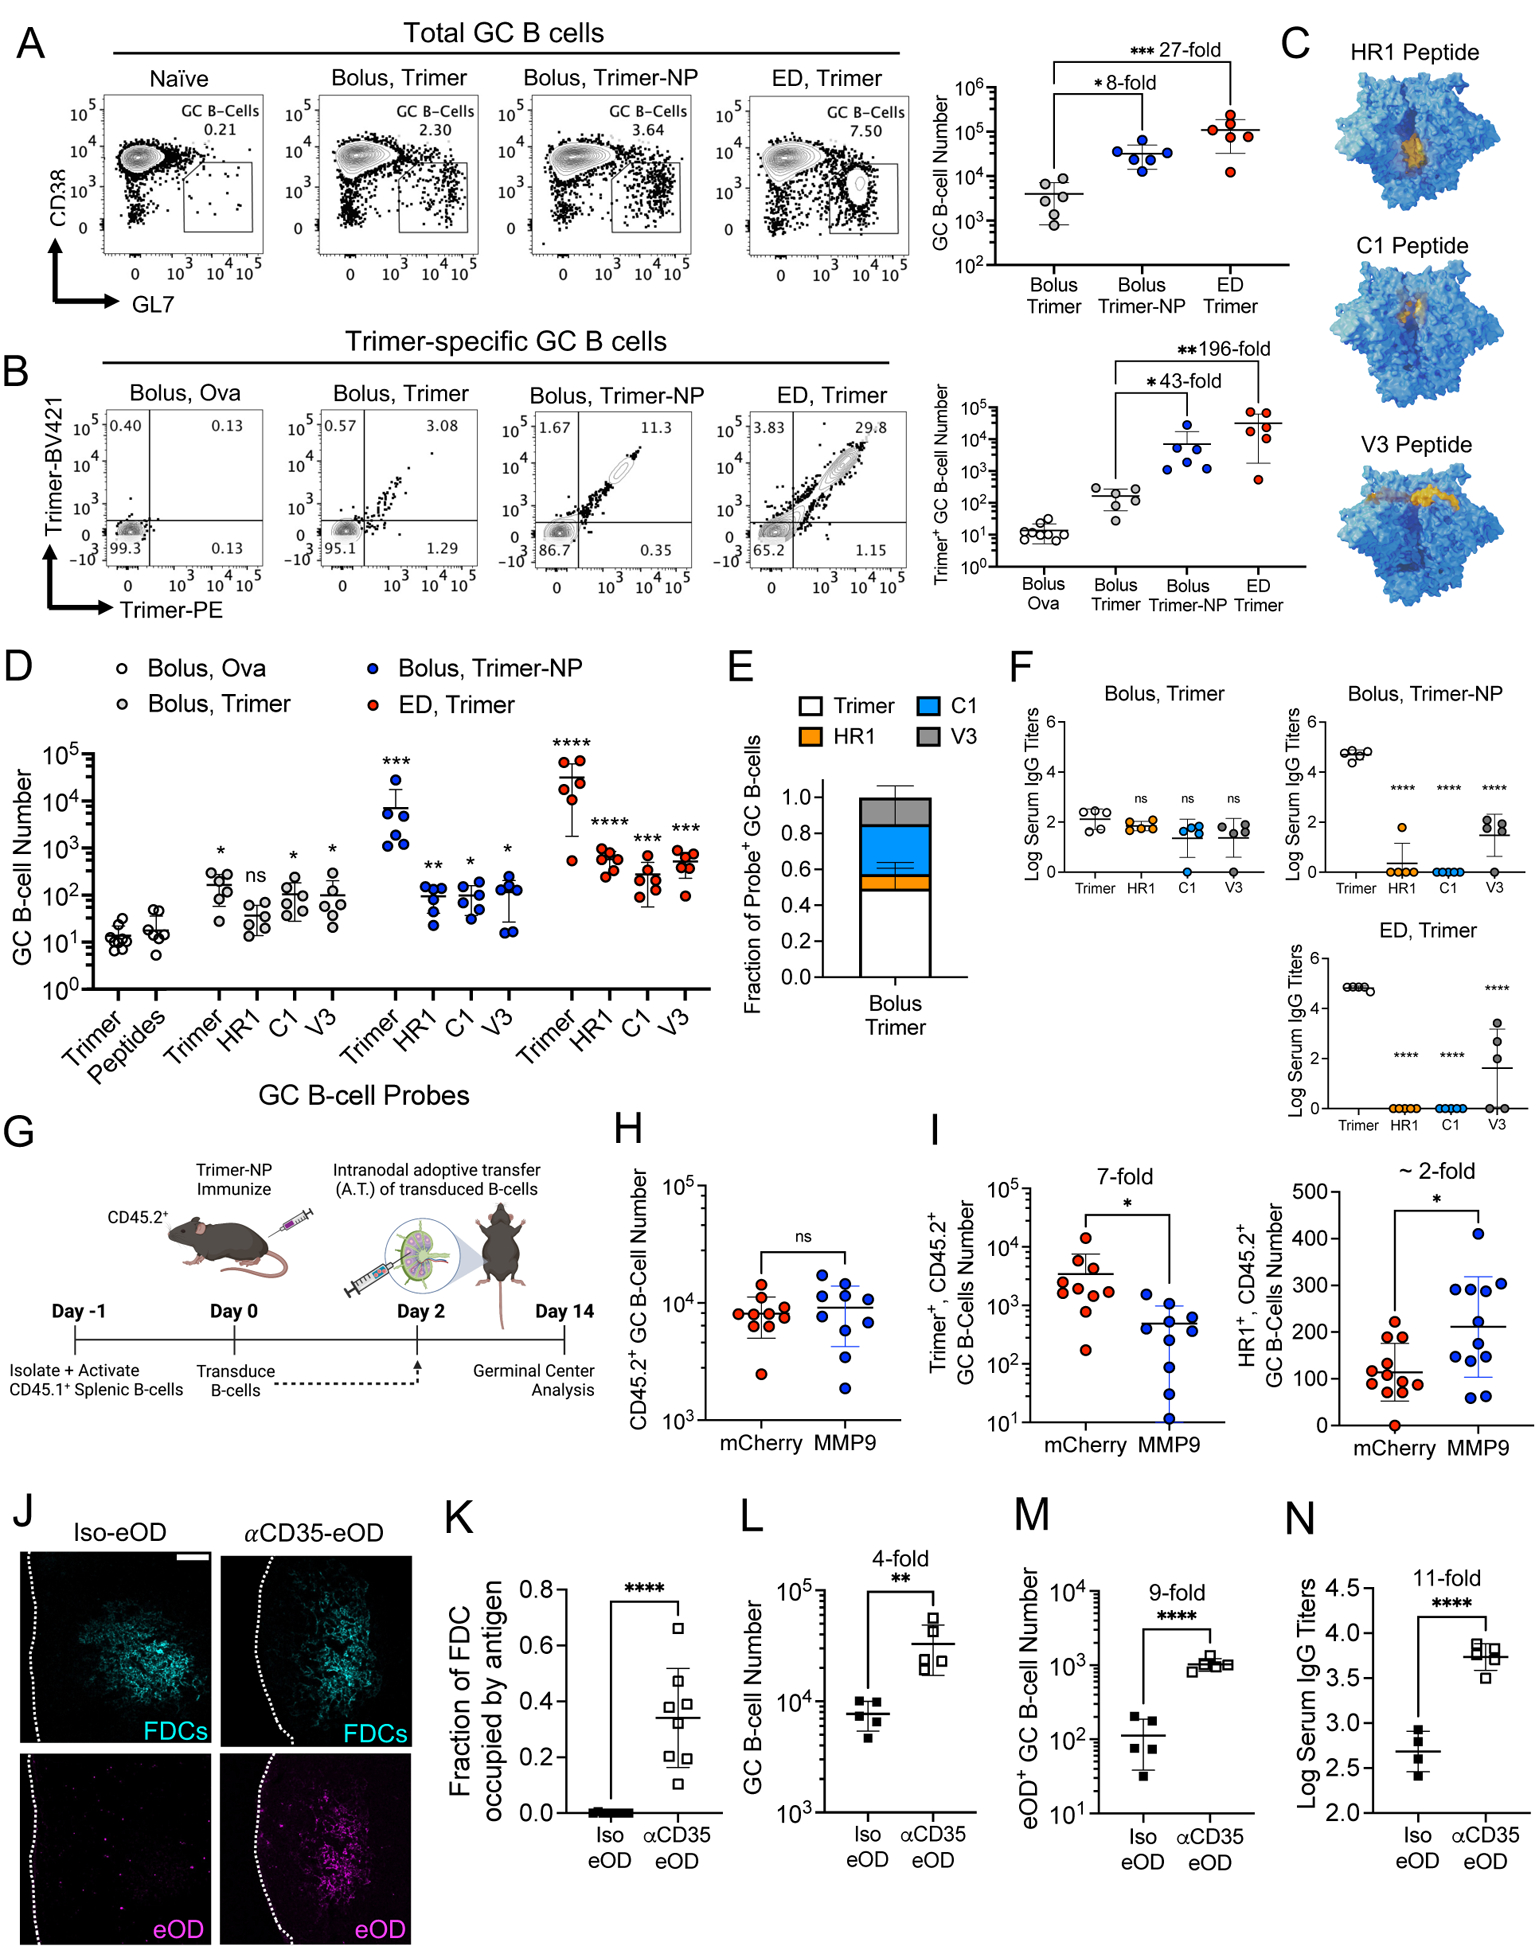
Figure 6: Targeting of immunogens to FDCs amplifies GC B cell responses against intact antigens without increasing the response to antigen breakdown products.

C57BL/6 mice (n =5–10 animals/group) were immunized with the indicated antigens and saponin adjuvant according to the dosing schemes. (A to E) LNs were harvested at day 14 for flow cytometry analysis. (A) Representative flow plots showing GC B cells (left) and their quantification (right). (B) Representative flow plots of intact trimer-specific GC B cells (left) and their quantification (right). *q ≤ 0.05; **q ≤ 0.01; ***q ≤ 0.001 by Kruskal-Wallis one-way ANOVA followed by two stage step-up method for comparison against bolus trimer. (C) Structural models of the HIV Env trimer highlighting (in yellow) the location of the HR1, C1, and V3 peptides used as probes to identify breakdown product specific GC B cells. (D) Enumeration of intact trimer and off-target peptide specific GC B cells after bolus, trimer-NP, ED trimer immunization, or bolus ovalbumin-immunized mice (control). ns, not significant; *, q ≤ 0.05; **q ≤ 0.01; ***q ≤ 0.001; ****, q ≤ 0.0001 by Kruskal-Wallis one-way ANOVA with two stage step-up method for comparison against bolus ovalbumin. (E) Distribution of GC B cells recognizing indicated probes after bolus trimer immunization. (F) Serum IgG titers against intact trimer or breakdown product on day 21. P values determined by one-way ANOVA and Dunnett’s post test against intact trimer. (G to I) MMP+ or control mCherry+ polyclonal B cells were adoptively transferred intranodally into mice (n =10 animals/group) immunized with 10 μg of trimer-NP and 5 μg of saponin adjuvant, followed by flow analysis. Shown are the experimental timeline (G) and enumeration of total host CD45.2+ GC B cells (H), intact trimer [(I), left], and HR1 peptide specific GC B cells [(I), right]. P values were determined by Student’s t test. (J to M) C57BL/6 mice (n =4–5 animals/group) were immunized with 2.5 μg of Iso-eOD or αCD35-eOD and 5 μg of saponin adjuvant, followed by histology and flow cytometry. Shown are images of labeled antigen in the FDC networks (J) and its quantification (K) 2 days after immunization. Scale bar, 100 μm. (L to N) Flow cytometry analysis enumerating GC B cells (L) and eOD-specific GC B cells at day 14 (M), and eOD-specific serum IgG titers at day 21 (N). P values were determined by Student’s t test. All plots show mean ± s.d.
