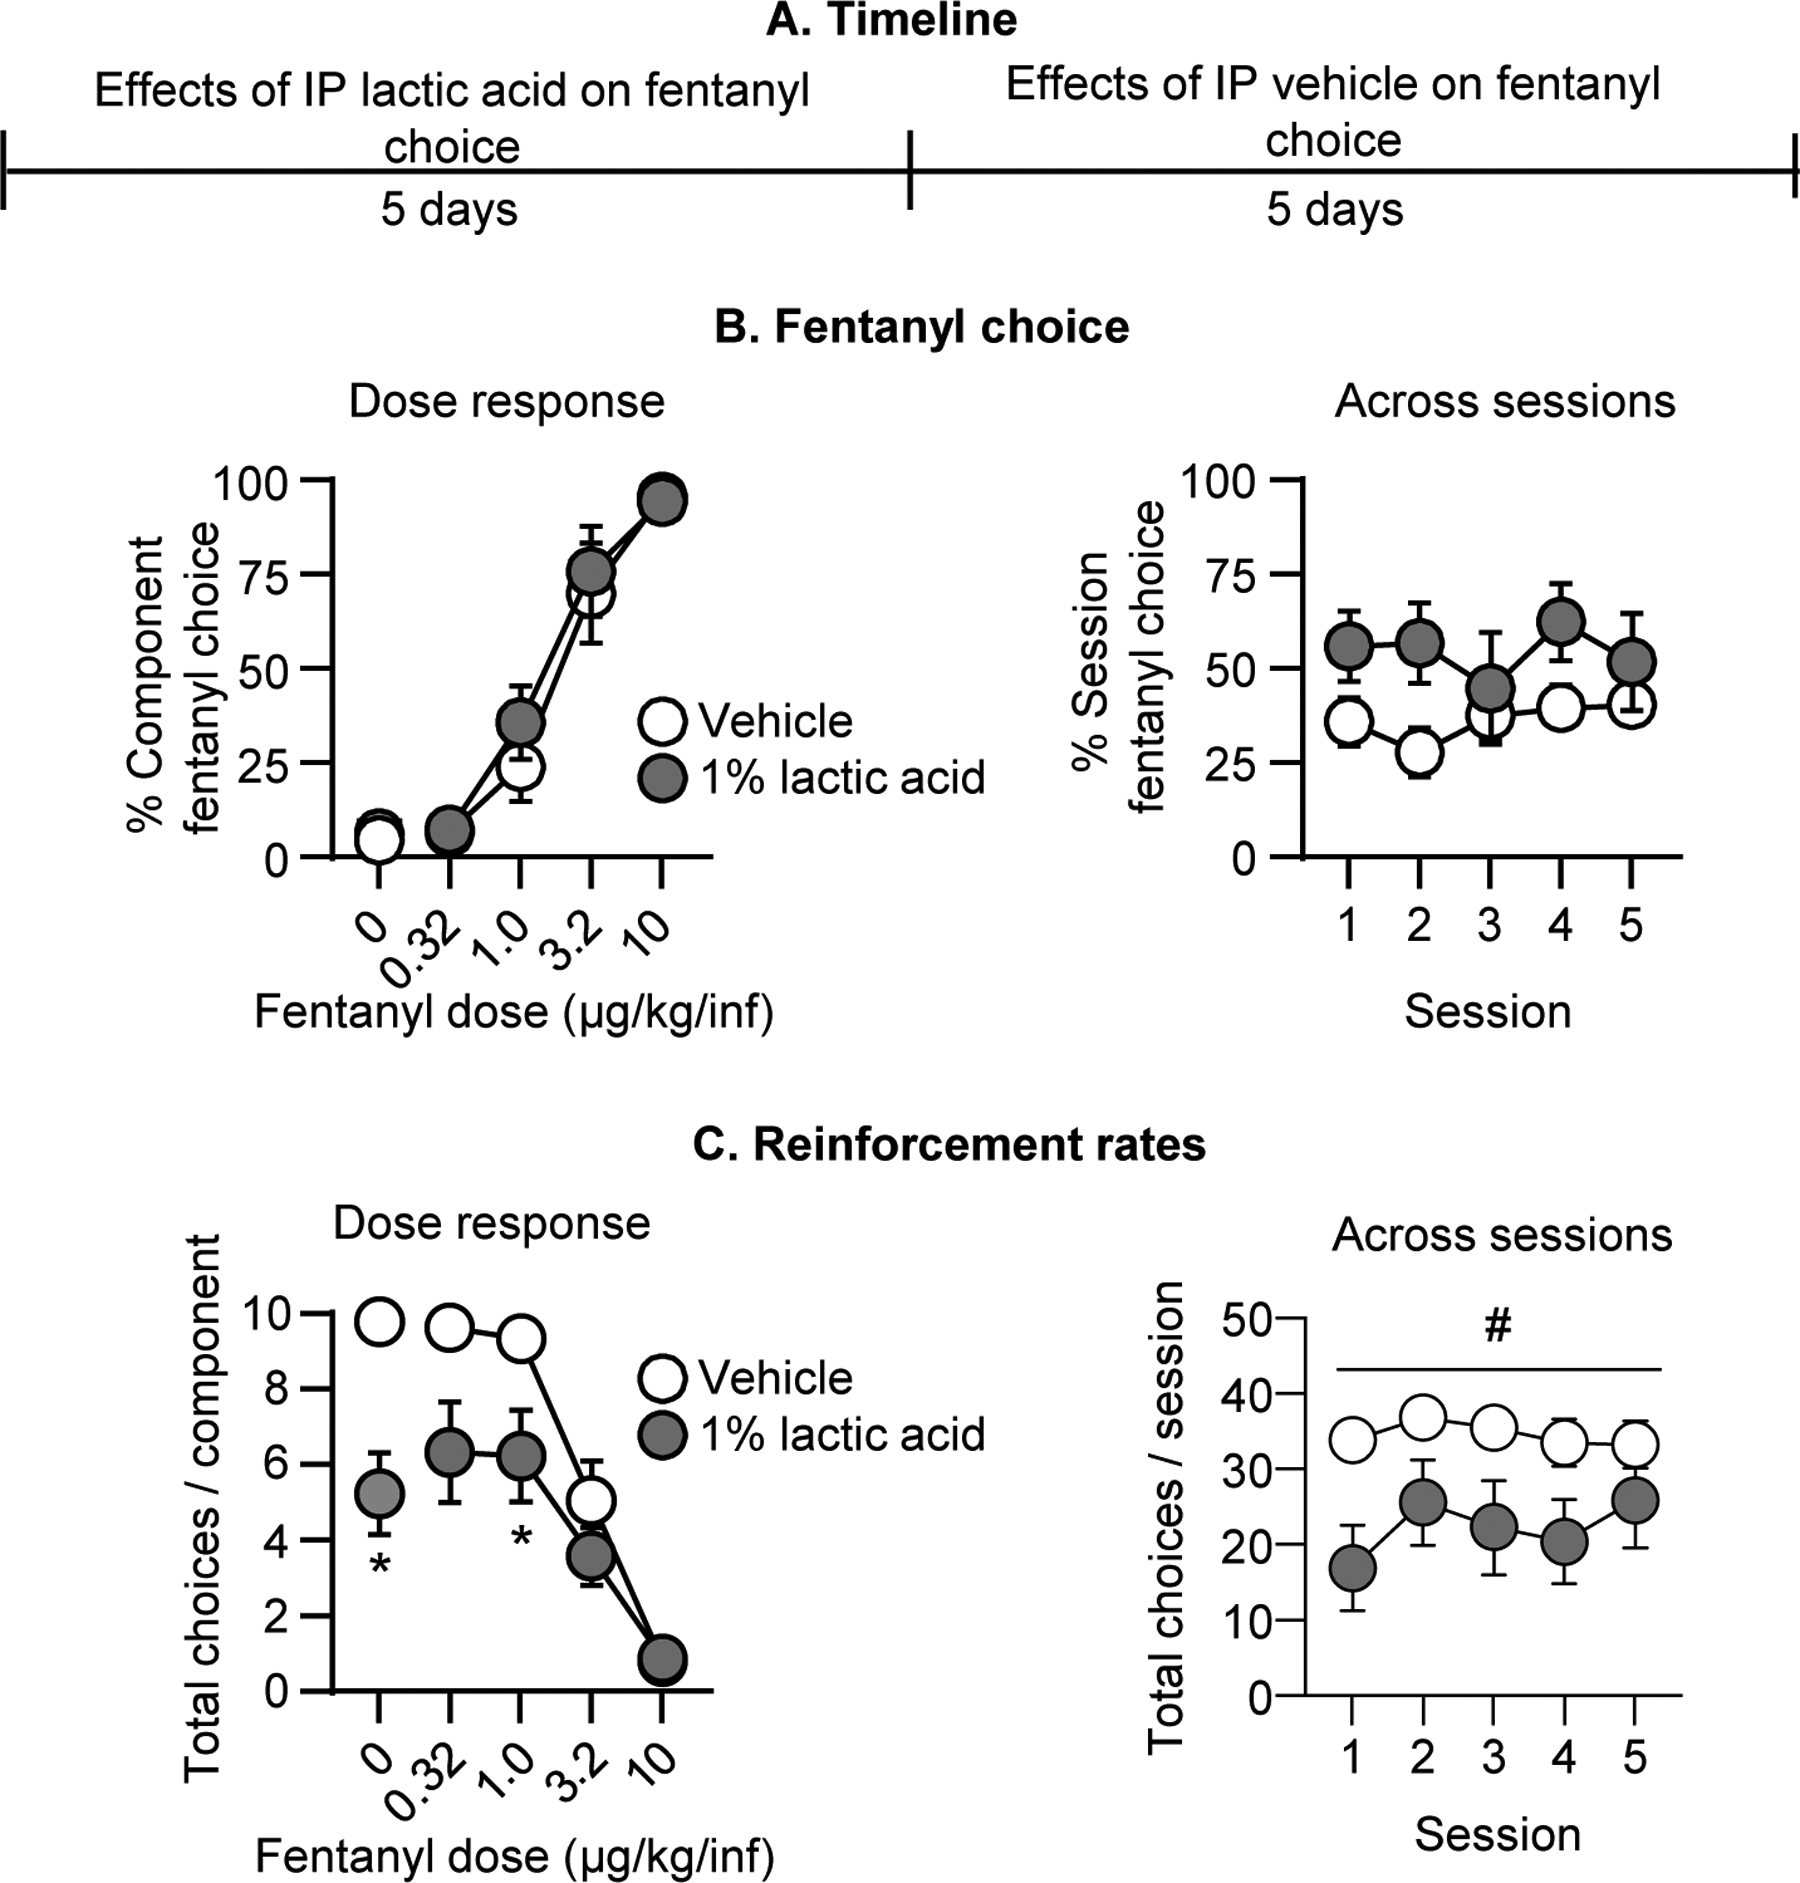
Figure 3. Effect of repeated i.p. lactic acid on fentanyl vs. food choice.

(A) Experimental timeline of Experiment 3A. (B) Fentanyl choice: Percent fentanyl choice across within-session fentanyl unit doses in rats injected i.p. with vehicle or 1% lactic acid (n=8, counterbalanced across rats). Left: Averaged across the five days of treatment and shown as a function of fentanyl unit dose. Right: Averaged across fentanyl unit dose and shown as a function of session for the five days of treatment. (C) Reinforcement rates: Total choices completed per component (maximum of 10 choices per component) across the within-session reinforcement-rate dose-response function. Left: averaged across the five days of treatment and shown as a function of fentanyl unit dose. Right: Averaged across fentanyl unit dose and shown as a function of session for the five days of treatment. * Difference from vehicle treatment at a given fentanyl unit dose, p<0.05. # Significant main effect of lactic acid, p<0.05. Data are mean ±SEM.
