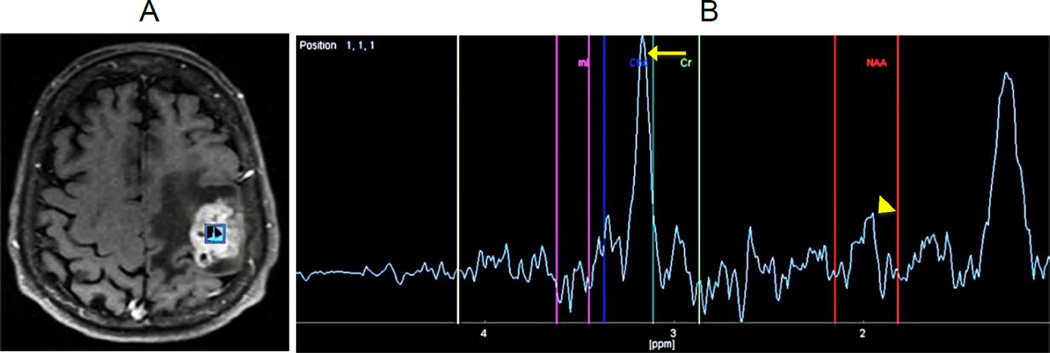
Figure 5. Magnetic resonance spectroscopy (MRS).
(A) Proton magnetic resonance spectroscopy (H-MRS) was performed using a time of echo (TE) of 136 with single voxel measuring 10×10×10mm placed within the enhancing portion of a left frontoparietal mass. (B) The resulted spectrum is abnormal with a dominant Choline (Cho) peak, and a decreasing in N-acetylaspartate (NAA) to the baseline level. Cho/Cr ratio was elevated at 2.5. Choline peak elevation (arrow) indicates an increasing in the cellular membrane turnover typical of most high grade tumors. The NAA peak decreasing (arrowhead) indicates tumor infiltration with loss of viable neurons.

