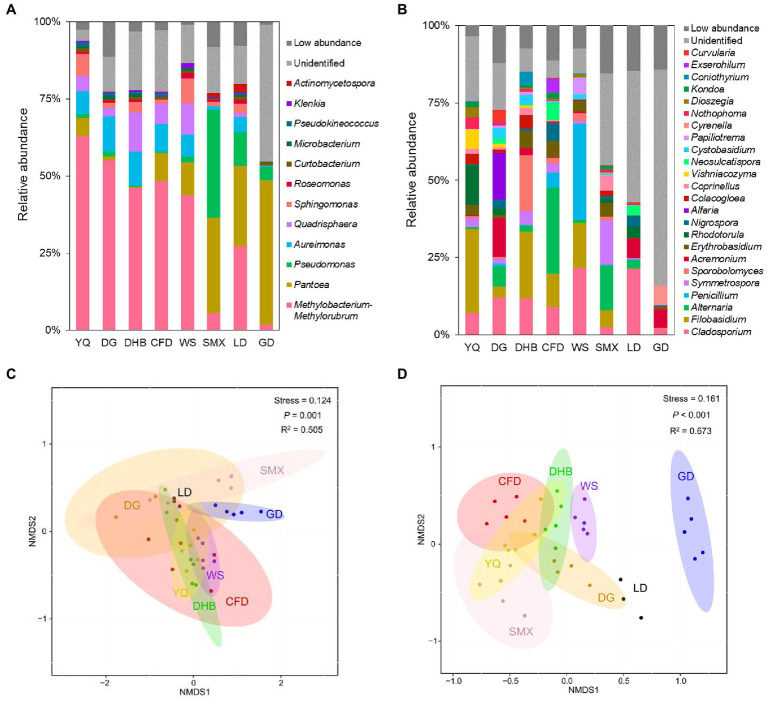
Figure 1.
Relative abundance at genus level of bacterial taxa (A) and fungal taxa (B) in the foliar microbiome of eight genotypes of wild soybean. The total relative abundance of low-abundant bacteria and fungi that accounted for less than 0.5% is indicated as low abundance in darkgrey, and unidentified taxonomic groups are indicated in light grey. At each sampling site, there were three to five technical replicates sampled from three to five plants with the same genotype. Abbreviations for the sample name are depicted in Table S1. The NMDS analysis of bacterial (C) and fungal (D) community at genus level based on Bray-Curtis distances categorized by host genotypes.

