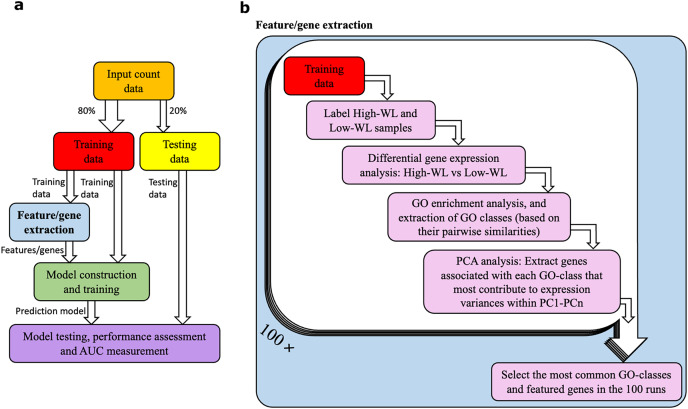
Figure 1. Data analysis workflow.
(A) Abstract illustration of the analysis performed during a single run (out of 100). Note that for each analysis (i.e., feature/gene extraction, and construction, training and testing of the prediction models) the necessary normalization and adjustment for sex, age and study center effects are carried out. (B) The “feature/gene extraction” precedes all other analysis (i.e., prediction model construction, training and testing) and is shown in further details. In each run the corresponding training data is analyzed. The outputs during the 100 runs are considered to extract the significant GO categories and genes that are used for construction of prediction models. Furthermore, the dimensions PC1-PCn collectively explain 70% of the gene expression variance.

