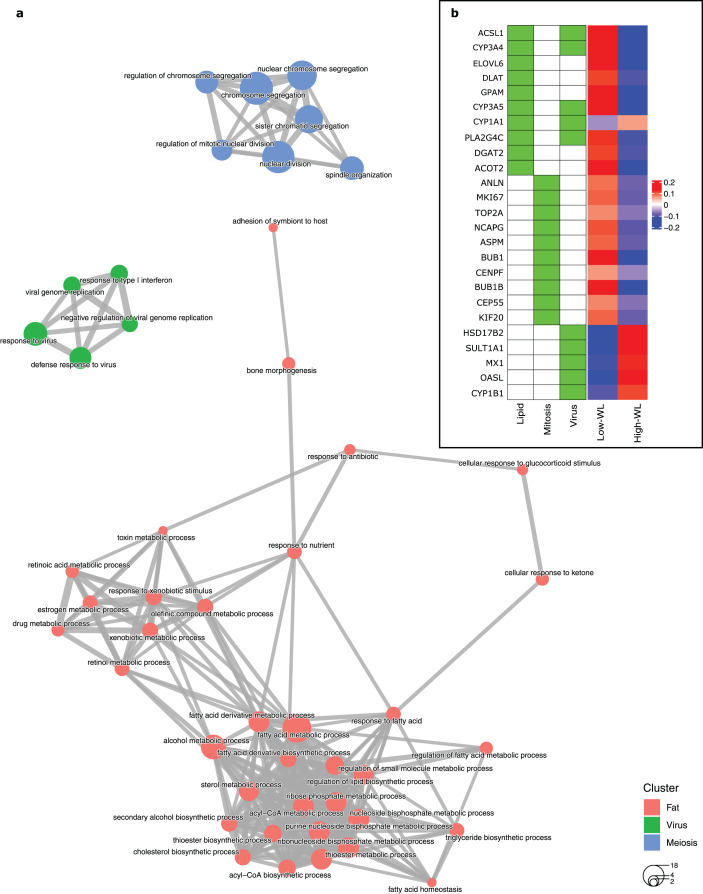
Figure 2. Baseline biological processes and the gene expression associated with weight loss status.
(A) Biological processes (GO categories) enriched in genes significantly differentially expressed in high-WL individuals vs. low-WL individuals. The biological process categories with ≥0.2 measured similarity are connected via an edge. The graph illustrates the largest non-overlapping class of biological processes associated with Lipid Metabolism, Mitosis, and Virus that was achieved throughout the 100 cross-validation runs. (B) Heatmap of the variance stabilizing transformation (VST) normalized read counts (at baseline), adjusted by age, sex and study center of the genes that were used in the Lipid Metabolism, Mitosis, and Virus weight-loss prediction models (scaled by row). The heatmap is plotted for the Low-WL and the High-WL individuals. The table on the left shows the annotations of the genes and the prediction models in which the expression of these genes where used as input parameters.

