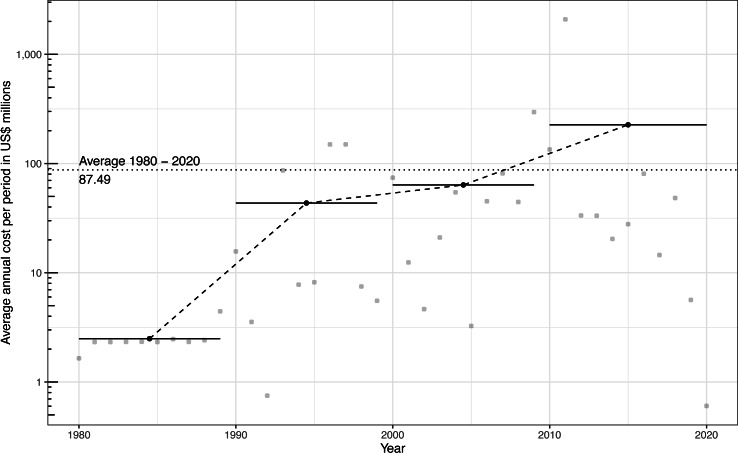
Figure 2. Temporal trend of global rodent invasion costs (in millions of 2017 US$) between 1980 and 2020.
The solid line represents the temporal dynamics of costs based on a linear regression, while the dashed line connects the average annual costs for each decade (see Leroy et al., 2022 for methodological details). The horizontal bars indicate the total time span over which decadal mean costs were calculated.

