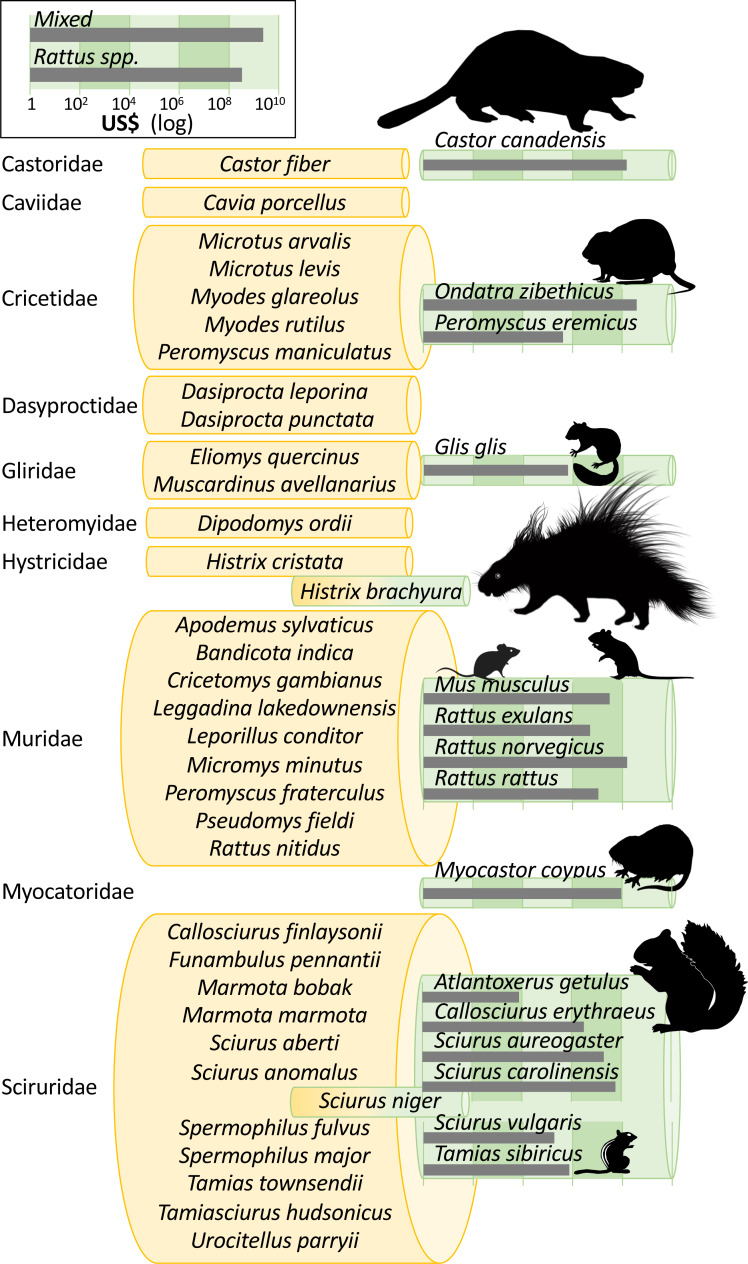
Figure 3. Taxonomic bias in the costs of invasive rodents.
Invasive rodent species are those recorded in the InvaCost database, the Global Invasive Species Database (GISD; http://www.iucngisd.org/gisd/) and the sTwist database (version 2; Seebens et al., 2020). Species with reported costs are in green rolls, while species without reported costs are in yellow rolls, all grouped following their taxonomic family. Species with dichromatic rolls (H. brachyura, S. niger) were in the original Rodentia subset, but were not considered in our conservative subset. Roll height is scaled to the number of species within each group and species silhouettes are sized to scale. Grey bars show total cumulative costs in 2017 US$ (log10 scale). Except Glis glis, Histrix brachyura, and Tamias sibiricus that were created by the authors, all animal silhouettes were obtained from an open source platform (http://phylopic.org/) where the silhouette of Rattus norvegicus was created by Rebecca Groom.

