
Extended Data Figure 2. Manhattan plots for genome-wide association results.
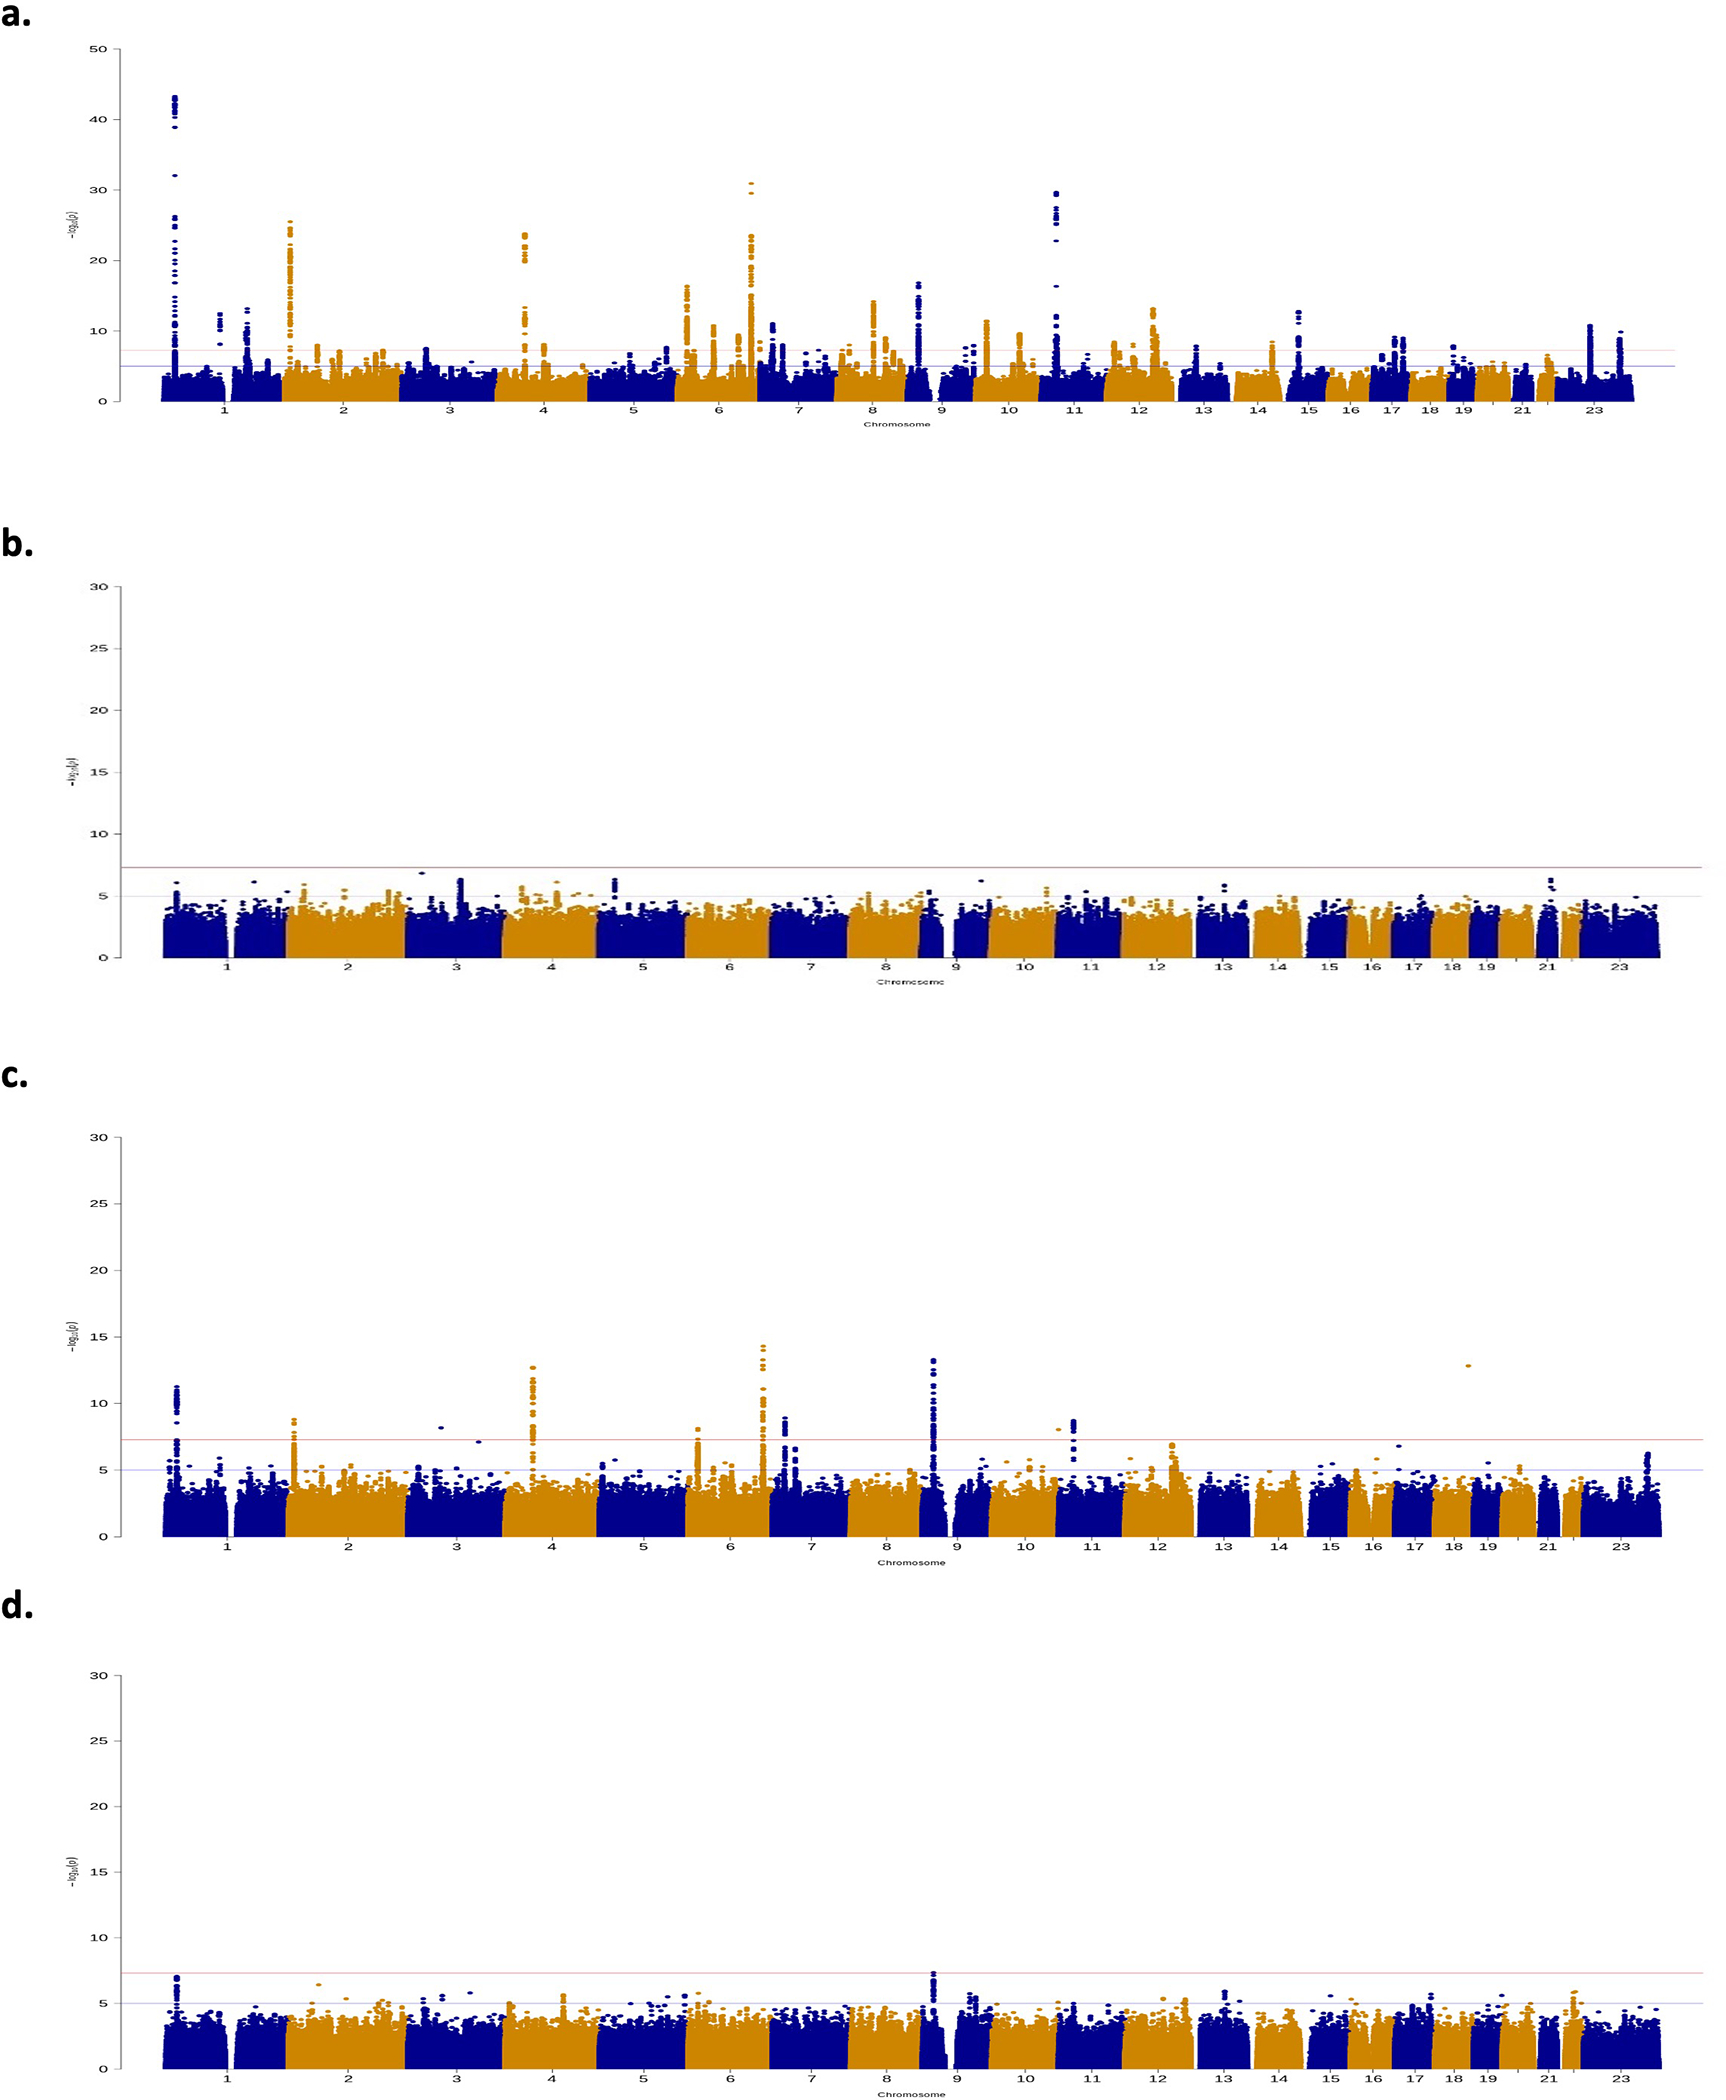
Manhattan plot for genome-wide association results for a. overall endometriosis, b. rASRM stage I/II endometriosis, c. rASRM stage III/IV endometriosis, d. endometriosis associated infertility. The GWAS meta-analysis results are shown on the y-axis as −log10(P-value) and on the x-axis is the chromosomal location. The red vertical line illustrates the genome-wide significance (p<5×10⁻⁸) and the blue vertical line shows the nominal genome-wide results (p<1×10⁻⁵).