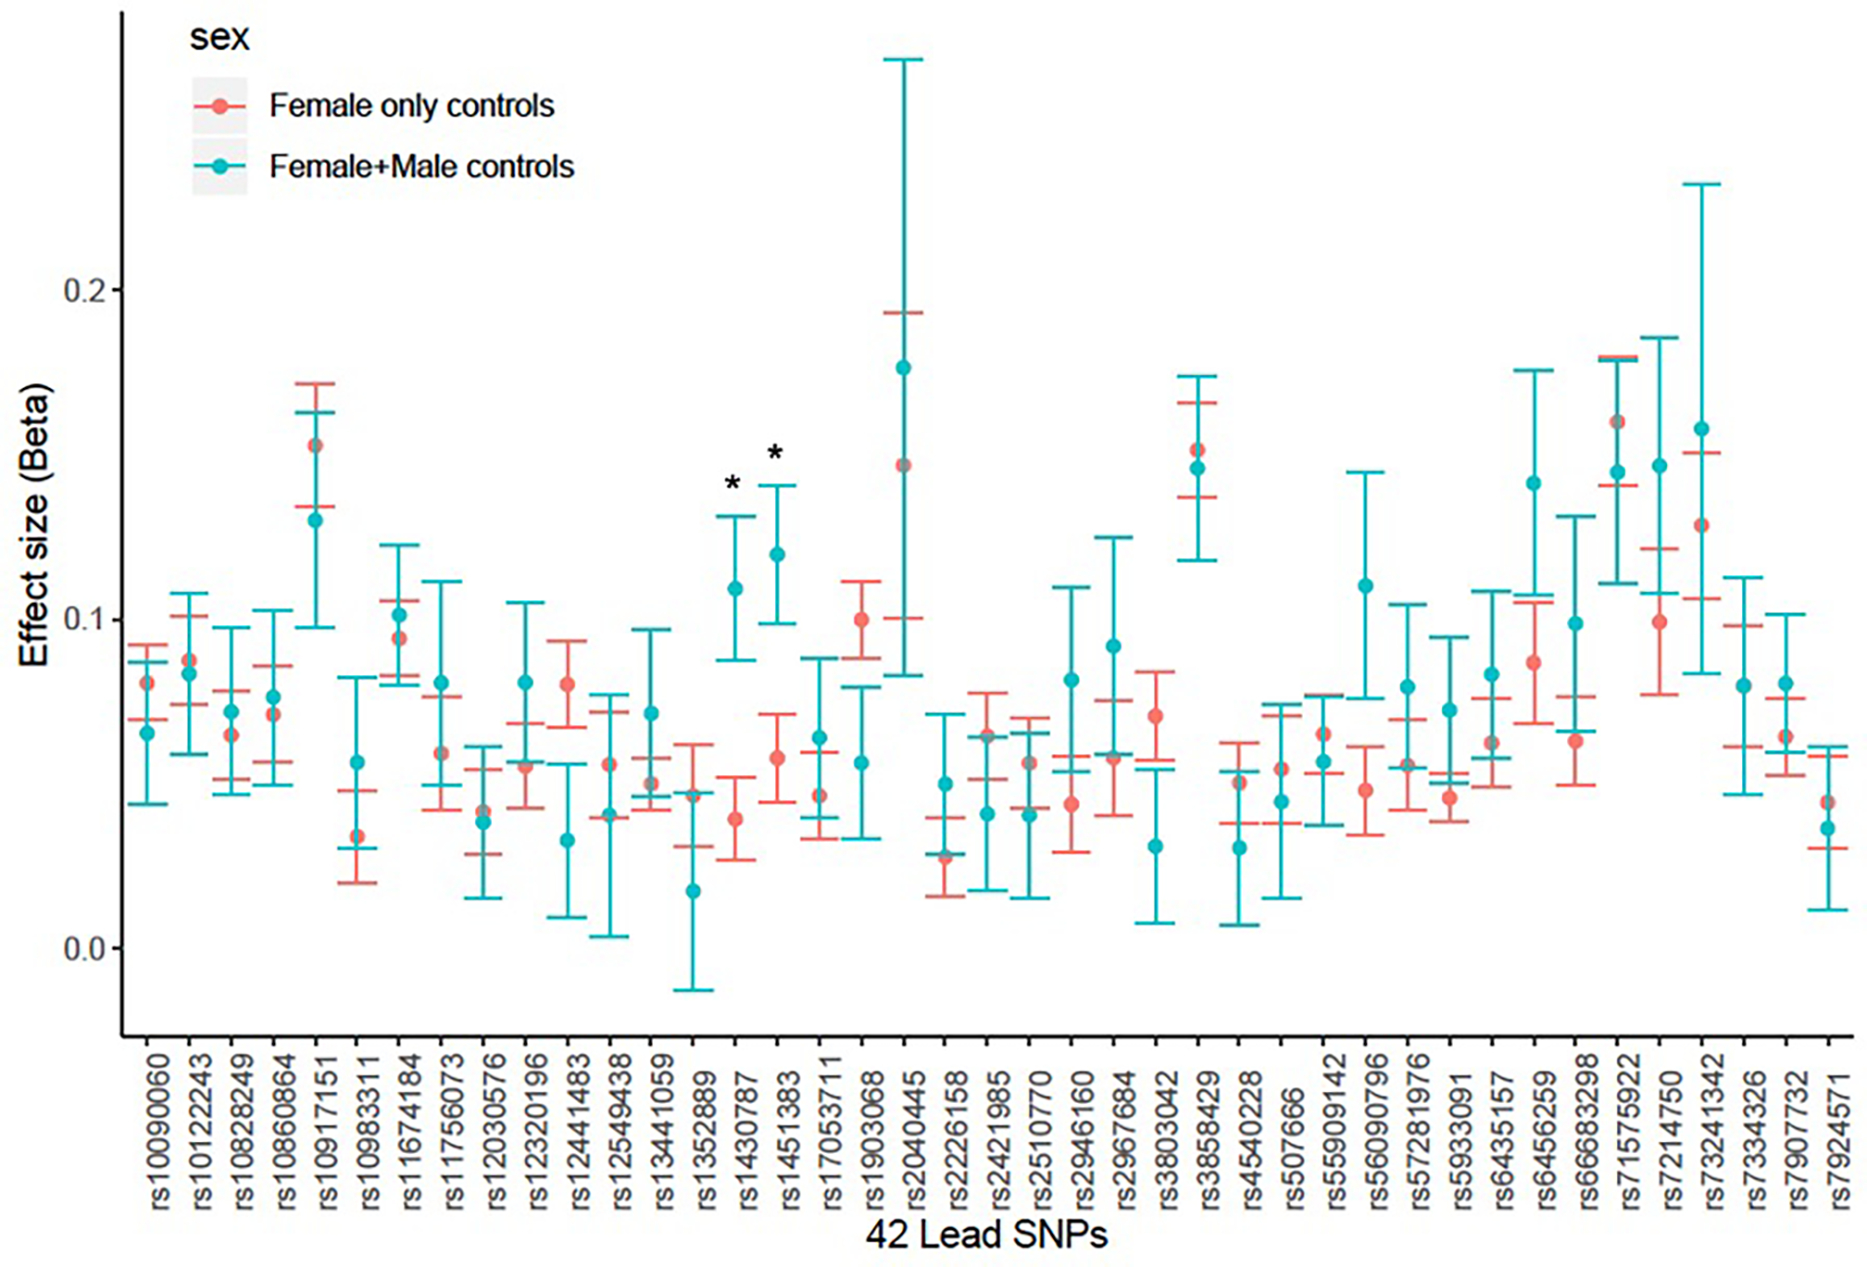
Extended Data Figure 3. Comparison of mixed female and male controls GWAS meta-analysis vs. female only controls GWAS meta-analysis results.

Results from meta-analysis contrasting GWAS studies with mixed female and male controls (N cases=5,222, N controls=44,176) vs. GWAS studies with only female controls (N cases=44,176, N controls=657,747). Significant heterogeneity: p-value<1.19×10⁻³ (0.05/42). The error bars represent standard error estimates for the beta co-efficient estimates. * SNPs with nominal heterogeneity p-values: rs1430787, p=0.03, rs1451383, p=0.01.
