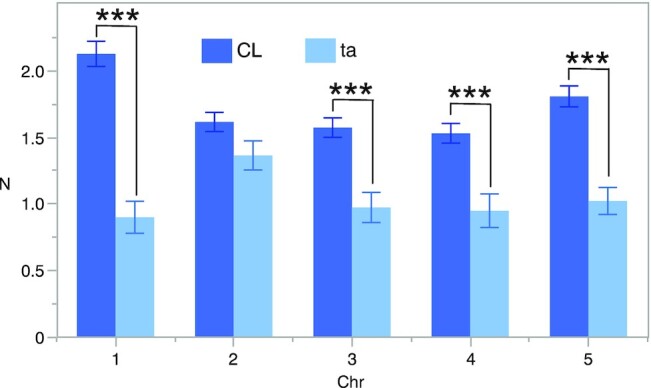
Fig. 4.

Mean chiasma frequencies per chromosome. The percentages represent the chromosome contribution to the total chiasma frequency. Means and SE values are shown. The mean values were significantly different (t-test P value <0.001) for all chromosomes, except for chromosome 2. The decrease in chiasma frequency was highest for the large chromosomes 1 and 5.
